Which Investment Questions Does AI Technical vs Fundamental Analysis Answer?
2026-08-24
How Do AI Technical and Fundamental Tools Split the What-to-Buy Versus When-to-Buy Decision?
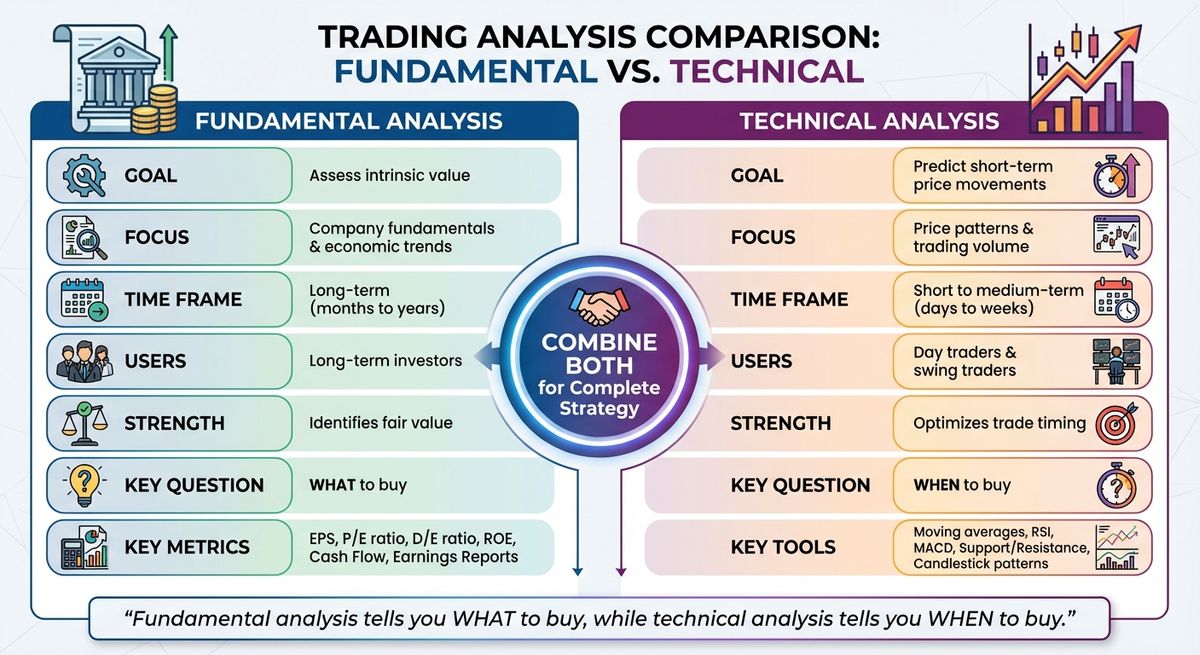
AI fundamental analysis is best at answering what is worth owning and why, while AI technical analysis is best at answering when a position has a favorable entry, exit, or risk point. That split is not a marketing slogan. It is the same division of labor CFA Institute researchers documented two decades ago: fundamental work chooses the securities; technical work chooses the timing for analysts who use both.
In 2026 the same questions still sit at the center of investment research. The difference is that language models can now read filings, estimate tables, price structure, and volume at a speed no desk could match by hand. The quality of the answer still depends on matching the question to the right evidence.
Key factors that separate useful AI research from generic market chat:
✅ Question type — valuation, durability, and cash-flow quality versus trend, momentum, and invalidation ✅ Data primitive — statements, transcripts, and estimates versus price, volume, and market structure ✅ Time horizon — quarters to years versus sessions to weeks ✅ Failure mode — a cheap-looking stock that stays cheap versus a clean chart that breaks ✅ Decision output — a thesis and peer set versus a setup, stop, and target
To compare tools honestly, it helps to judge them by the research questions they can actually close, not by how many indicators or documents they advertise.
Why Are Investors Pairing AI With Both Analysis Schools in 2026?
Investors are pairing AI with both schools because research volume has outgrown manual reading, while the underlying decision is still two-sided: own the right asset, then time the risk. Amundi’s 2025 review of AI in investment research framed the shift around faster data analysis, scenario modeling, and entirely new research fields rather than a single replacement for human judgment.
The adoption backdrop is broader than asset management. A Federal Reserve note on U.S. firm data reported that about 18 percent of firms had adopted AI by year-end 2025. McKinsey’s 2025 State of AI survey likewise treated AI as an operating question for headcount and workflow design, not a novelty feature. Research desks feel that pressure first: earnings land in minutes, consensus revises overnight, and charts invalidate while a memo is still being formatted.
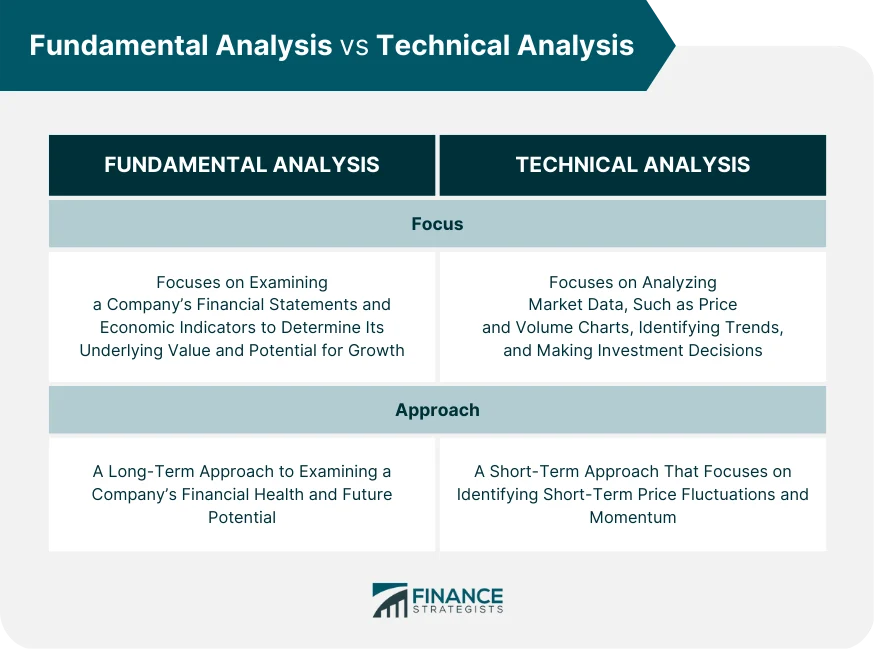
That is why the old “charts versus spreadsheets” argument is the wrong frame. Investopedia’s standard distinction still holds: fundamental analysis estimates intrinsic value from economic and financial factors, while technical analysis studies price action. AI does not erase that difference. It compresses the time needed to interrogate each side.
The practical result is specialization. Conversational agents grounded in filings are being asked cash-flow and competitive-moat questions. Charting platforms with automated pattern recognition are being asked breakout, breadth, and invalidation questions. Hybrid stacks appear when the same investor needs both answers before risking capital.
What Should You Evaluate When Choosing an AI Investment Research Tool?
You should evaluate an AI investment tool by the question it is built to close, the evidence it can cite, and the decision it can support without forcing you to switch context. Feature lists are a weak proxy. A filings chatbot that cannot explain relative valuation will fail a fundamental question. A pattern engine that cannot define invalidation will fail a technical one.
A useful screen is the Question-Fit Framework — six tests that keep the comparison honest:
- Decision object — Does the tool output a business thesis or a trade setup?
- Evidence chain — Can it point to a filing line, estimate, or price level rather than a vibe?
- Horizon match — Is the default unit a fiscal year or a session?
- Memory — Does it remember your constraints across sessions, or reset every chart?
- Error transparency — Does it state what would falsify the view?
- Cost to operate — Is the workflow a $20 conversational seat or an [**$80,000–$200,000 professional data stack**](https://www.linkedin.com/posts/michael-hochstat_ai-investing-finance-activity-7468064408657670144-C9_h)?
Those tests explain why two products can both be labeled “AI stock analysis” and still answer incompatible questions. WallStreetZen’s 2026 roundup of AI stock analyzers grouped tools by job — ratings, virtual analyst reports, active-trading scanners, automated charting — which is closer to how desks actually buy software.
Apply the framework before you compare brands. If your question is “Is this franchise still earning excess returns after the last capital cycle?”, you need statement-level reasoning. If your question is “Is the weekly structure still intact after yesterday’s gap?”, you need market-structure reasoning. Buying the wrong category produces confident answers to a question you did not ask.
Which AI Tools Are Best for Fundamental Questions Versus Technical Questions?
Specialized agents and platforms now cluster cleanly: some are built to interrogate businesses, others to interrogate price. Jenova’s Fundamental Stock Analyst is strongest when the question is earnings quality, relative valuation, or business-model durability. Jenova’s Technical Stock Analyst is strongest when the question is market structure, momentum confirmation, or defined-risk timing.
They are not the only credible options. TrendSpider automates trendlines, Fibonacci levels, and hundreds of candlestick patterns, and its Sidekick assistant can pull corporate metrics and filings into a charting workspace. AlphaSense is an enterprise research system over a licensed library of broker reports, expert calls, and filings. Fiscal.ai is closer to data infrastructure: auditable statements published minutes after earnings. TradingView remains the default visual canvas for discretionary technicians, even as automated platforms try to replace manual drawing.
The comparison below is reference-grade, not a ranking. Depth differs because some products publish institutional content libraries and others publish charting automation.
| Feature / Dimension | Jenova Fundamental Stock Analyst | Jenova Technical Stock Analyst | TrendSpider | AlphaSense | Fiscal.ai |
|---|---|---|---|---|---|
| Primary question | What is the business worth, and why? | When is risk/reward favorable? | Where are objective chart levels and patterns? | What do filings, brokers, and experts say? | What are the clean numbers right now? |
| Core evidence | Earnings, valuation, business model, estimates, sentiment | Price action, volume, momentum, market structure | Automated TA, 400+ indicators, alt data overlays | 500M+ licensed documents, expert calls, models | Source-auditable financials via terminal/API/MCP |
| Horizon default | Quarters to years | Sessions to weeks | Multi-timeframe, trader-defined | Research cycle / deal cycle | Filing timestamp |
| Honest limitation | Not a licensed broker-research terminal or execution blotter | Conversational structure work, not a full visual backtesting lab | Charting-first; research chat is secondary to the workspace | Limited real-time trading data versus Bloomberg; enterprise cost | Stronger as data plumbing than as a reasoning partner |
| Pricing (as of 2026) | Free tier; paid plans from $20/month | Same Jenova tiers | Subscription; public list tiers unverified here | Enterprise / team license | Terminal, API, MCP; list pricing unverified |
| Best for | Equity thesis work and relative valuation | Setup quality and invalidation | Automated technical workflow | Institutional document synthesis | Fast, auditable post-earnings data |
Jenova’s advantage is conversational persistence: both agents can keep a running view of your constraints, watchlist, and prior conclusions. The matching limitation is equally important. Neither agent is a Bloomberg-style market-data terminal, and neither replaces TrendSpider’s visual automation or AlphaSense’s licensed broker corpus. Teams that need all three jobs still assemble a stack.
What Research Questions Does AI Fundamental Analysis Handle Best?
AI fundamental analysis is best suited to questions about intrinsic value, earnings quality, competitive position, and whether the current price is a reasonable claim on future cash flows. Those questions live in statements, footnotes, guidance, and peer multiples, not in a 15-minute candle.
The New York Institute of Finance still describes the school in those terms: industry trends, financial records, and economic outlook. CME Group’s education material makes the same point on the futures side — supply, demand, and the forces that create value. AI changes the retrieval speed, not the object of study.
Questions this school closes well:
- Is reported growth real? Accruals, cash conversion, one-time items, and revenue recognition.
- What is the business actually worth versus peers? P/E, EV/EBIT, FCF yield, and ROIC against a coherent competitor set.
- Did the story change on the call? Guidance, capex, customer concentration, and tone versus the last two transcripts.
- Where does the balance sheet break? Leverage, refinancing walls, working-capital strain, dilution.
- Is the moat widening or eroding? Mix shift, pricing power, unit economics, and reinvestment need.
Jenova’s Fundamental Stock Analyst is built for exactly that interrogation: earnings analysis, relative valuation, business-model assessment, and current data across SEC filings, analyst estimates, and market sentiment. A productive prompt looks like research instruction, not a price target request:
"Walk through the last two 10-Qs and the latest earnings call for the company. Separate organic growth from M&A, flag any cash-conversion gap versus net income, and compare forward EV/EBIT to its closest three peers."
Document-grounded alternatives answer overlapping questions with different plumbing. Screener AI gives models direct access to annual reports and earnings calls so users can ask in plain language without uploading files. AlphaSense adds licensed broker research, more than 280,000 expert interviews, and Smart Summaries of transcripts — closer to how a buy-side associate actually assembles a company file. Fiscal.ai’s claim is narrower and useful: clean, auditable financials minutes after a filing, which matters when models and terminals otherwise lag the print.
Fundamental AI fails when you ask it to time a breakout. A cheap multiple is not an entry. A strong ROIC is not a stop. Those are technical questions wearing a value costume.
What Research Questions Does AI Technical Analysis Handle Best?
AI technical analysis is best suited to questions about trend integrity, momentum confirmation, liquidity, and the price at which a thesis is wrong. It assumes that the market is not perfectly efficient and that price and volume carry information independent of the latest 10-K.
That makes it the right tool for a different list:
- Is the higher-timeframe trend still intact? Swing structure, moving-average regime, higher highs and higher lows.
- Where is the invalidation? Prior demand, range extremes, gap fills, measured-move targets.
- Does momentum agree with price? RSI, MACD, breadth, and divergences on the same horizon as the trade.
- Is participation real? Volume expansion, dark-pool prints, unusual options, or thin retail chase.
- When should size increase or come off? Break-retest behavior, failed breakouts, and volatility expansion.
Jenova’s Technical Stock Analyst is designed as an institutional-style market-structure partner: charts, volume, and momentum, with an emphasis on high-probability setups and defined risk. A useful prompt specifies horizon and risk, not a hoped-for price:
"On the daily and weekly charts, map current market structure, the nearest invalidation, and whether momentum confirms the last breakout. State the setup only if risk can be defined in advance."
Charting platforms still win on visual density. TrendSpider’s product documentation describes automated detection of trendlines, Fibonacci levels, wedges, channels, head-and-shoulders, and more than 300 candlestick patterns, plus multi-timeframe overlays so a trader is not flipping screens to see the weekly context. Sidekick can also query fundamentals and filings, which is why TrendSpider sits nearer the hybrid middle than a pure drawing tool. TradingView remains the broader social and scripting canvas; comparison pieces such as VectorVest’s 2026 review typically give TrendSpider the edge on automation and TradingView the edge on community and manual flexibility.
Technical AI fails when you ask it whether a business is durable. A perfect cup-and-handle on a structurally shrinking franchise is still a deteriorating asset. Timing a bad business well is not the same as answering a fundamental question.
When Does Combining Both Approaches Produce Better Investment Decisions?
Combining both approaches produces better decisions when the fundamental question has already identified a security worth owning and the technical question can improve entry, add, or exit without changing the thesis. John Bollinger, who holds both the CFA and CMT designations, called that junction “rational analysis”: take the best tools from each box rather than pretending cars come in only two colors.
The CFA record is specific, not poetic. Christopher Orndorff, then head of equity strategy at Payden & Rygel, said fundamental analysis drove which securities to own, while purchase and sale timing split roughly evenly between technical and fundamental signals. Andreas Sauer, CFA, argued that fundamentals provide the deeper valuation framework and still used momentum and reversal factors inside quantitative models. The combined process is older than chat interfaces.
AI makes the combination cheaper to run and easier to fake. The failure mode is “confirmation soup”: a model that restates a bullish chart as a bullish thesis, or a bullish thesis as a bullish chart, without an independent evidence chain. A clean combination keeps the questions sequential.
A sound sequence looks like this:
- Qualify the asset with fundamental questions — unit economics, leverage, reinvestment, valuation versus peers.
- Map the path with technical questions — structure, invalidation, and whether the market is already pricing the good news.
- Size the risk only after both answers exist.
- Revisit each side on its own clock — fundamentals after prints and filings, technicals after structure breaks.
Adjacent Jenova agents fit that sequence without turning one chat into an undifferentiated oracle. A Macro Strategist can test whether the fundamental view is fighting the policy regime. A Portfolio Management Strategist can ask whether adding the name creates factor or drawdown concentration. An Economics Analyst can pressure-test the demand assumption behind a multi-year earnings path. Those are still fundamental-adjacent questions. They do not replace a chart when the issue is timing.
Do not combine the two schools when the holding period is a few hours and the only edge is tape reading, or when the mandate is private-company underwriting and there is no meaningful public price series. Forced hybridization is how research becomes theater.
How Do You Get Better Answers From AI Technical and Fundamental Research Tools?
You get better answers by stating the decision, the horizon, the evidence you will accept, and what would kill the idea — then sending that brief to the tool built for that job. Vague prompts produce vague authority. The workflow below works on Jenova agents and, with small changes, on TrendSpider Sidekick or AlphaSense Generative Search.
1. Write the decision in one sentence. “I need to decide whether to start a 12-month position,” is a brief. “What do you think of this stock?” is not.
2. Split the brief into two questions. Fundamental: quality and price versus value. Technical: path and invalidation.
3. Ground the fundamental pass in documents. On the Fundamental Stock Analyst:
"Using the latest 10-K, last two 10-Qs, and the most recent earnings call, assess return on invested capital, free-cash-flow conversion, and net leverage. Tell me what would have to be true for the current multiple to be justified."
On AlphaSense or Screener AI, ask the same question so the model is forced onto transcripts and filings rather than web summaries.
4. Ground the technical pass in structure and risk. On the Technical Stock Analyst:
"Assume a 4- to 8-week swing. Identify trend regime, the level that invalidates the long, and whether volume confirms. If the setup is not asymmetric, say so."
On TrendSpider, the equivalent is less conversational and more mechanical: load the chart, enable automated trendlines and multi-timeframe analysis, then ask Sidekick to sanity-check the levels you intend to trade.
5. Reconcile without averaging. If the business is attractive and the weekly structure is broken, wait or scale smaller. If the chart is perfect and the filings show deteriorating cash conversion, pass. Averaging a “6” and a “9” into a “7.5 buy” is how two good analyses become one bad decision.
6. Keep a kill switch for each side. A fundamental kill switch is a broken thesis: lost pricing power, a leverage event, a structural margin reset. A technical kill switch is a price. Mixing them — “I’ll hold through the stop because the story is good” — is how defined-risk work becomes a hope trade.
Jenova’s free tier covers limited daily use of these agents; paid plans start at $20/month with substantially higher usage. That is enough for most individual research loops. It is not a substitute for an AlphaSense or Bloomberg seat when the job is searching licensed broker notes across a coverage universe.
What Do Investment Professionals Say About Mixing Technical and Fundamental AI?
Investment professionals who have used both toolkits tend to treat fundamentals as the ownership filter and technicals as the timing and risk filter, and they are skeptical of any system that collapses those jobs into a single score.
"The most expensive mistake we see is asking one model to certify both the business and the chart. A filings-grounded agent can tell you whether cash conversion is deteriorating. A market-structure agent can tell you whether buyers still defend last week’s low. Those are different claims, and they go stale on different clocks. When teams blend them into one ‘AI rating,’ they lose the ability to say which evidence broke."
"Persistent memory changes the research process more than a new indicator does. If the fundamental agent remembers that you already rejected a name on leverage, it should not re-pitch the same story because the daily RSI reset. If the technical agent remembers your invalidation, it should not invent a new thesis after a stop. The point of AI here is continuity and auditability, not a louder opinion."
"Institutional stacks still exist for a reason. Licensed broker research, expert calls, and real-time market data answer questions a conversational agent should not pretend to own. The complementary design is a cheap, memory-rich reasoning layer on top of — not instead of — the data you already trust."
— Jenova Product Team, investment-research product leads with experience across equity analysis and market-structure tooling
That view lines up with the older professional record. Sauer preferred a deeper fundamental framework and still incorporated momentum. Orndorff split timing between the two schools. Bollinger refused the idea that the toolboxes were mutually exclusive. AI did not invent the synthesis. It made sloppy synthesis faster.
Which Approach Fits Your Time Horizon and the Decision You Actually Need to Make?
Match the school to the decision’s half-life: multi-quarter ownership questions belong to fundamental AI, path-and-risk questions belong to technical AI, and only staged capital allocation needs both. Horizon is the cleanest sorting variable because it determines which evidence can still be true when you must act.
Multi-year compounders and concentrated longs. Start with the Fundamental Stock Analyst, Fiscal.ai or another filings feed for clean numbers, and — if budget allows — AlphaSense for broker and expert context. Technical input is secondary: use it to avoid buying a climax or to add on a higher-timeframe retest.
Swing trades measured in days to weeks. Start with the Technical Stock Analyst or a visual platform such as TrendSpider or TradingView. Run a short fundamental pass only to avoid structurally impaired issuers and binary event risk. You are not building a discounted-cash-flow model between Tuesday and Thursday.
Event-driven work around earnings. Reverse the usual order. Use fundamental AI to list the variables that would change the thesis, then use technical AI to map gap risk, implied move, and where liquidity likely sits after the print. The question is not “is this cheap?” It is “what price action would confirm or deny the new information?”
Portfolio construction rather than single-name heroics. After either school produces candidates, move the conversation to allocation, drift, and stress. That is a portfolio question, not a chart question and not a 10-K question. Tools that only score tickers leave this step out.
Cost and access constraints. A conversational pair of agents on a low monthly seat can close a surprising share of individual-investor questions. It will not reproduce AlphaSense’s coverage of 27,000-plus public companies and 1,700-plus broker sources, and it will not reproduce TrendSpider’s automated multi-timeframe drawing. Knowing which questions you can leave unanswered is part of the fit.
The durable rule is simple enough to cite on its own. If the unanswered question is what kind of asset this is, use fundamental AI. If the unanswered question is whether the market is offering a defined-risk moment, use technical AI. If both are unanswered, do not trade yet.
References
- CFA Institute — Fundamental vs. Technical Analysis
- Investopedia — Fundamental vs. Technical Analysis: What’s the Difference?
- Amundi Research Center — AI Investment Research: 2025 Trends
- Federal Reserve — Monitoring AI Adoption in the U.S. Economy
- McKinsey — The State of AI: Global Survey 2025
- LinkedIn — Professional research-stack cost commentary
- WallStreetZen — The 7 Best AI Stock Analyzers in 2026
- TrendSpider — Technical, Fundamental & Alternative Charting
- AlphaSense — AlphaSense vs. Bloomberg
- Fiscal.ai — Financial data infrastructure
- Screener AI — Filings and earnings-call research assistant
- New York Institute of Finance — Technical Analysis vs Fundamental Analysis
- CME Group — Fundamental Analysis vs Technical Analysis
- VectorVest — TrendSpider vs TradingView Comparison