Which AI Technical Analysis Tool Is Best for Trends and Key Levels?
2026-08-23
How Do AI Chart Tools Compare on Structure, Volume, and Invalidation?
The most useful AI technical analysis tools in 2026 are the ones that treat a chart as a decision system, not a pattern catalog. Jenova's Technical Stock Analyst is strongest when you need a reasoned market-structure read with explicit invalidation, while TrendSpider leads automated trendline and pattern drawing, TradingView leads visual charting depth, and Tickeron leads scored pattern probabilities.
That distinction matters more than brand names. A tool can highlight a double top and still leave you without a stop, a volume confirmation rule, or a price that kills the thesis.
Key factors that separate usable AI chart analysis from decorative overlays:
✅ Structure first — trend, swing highs/lows, and support/resistance treated as zones rather than exact lines ✅ Volume as confirmation — breakouts and reversals need participation, not just a shape on the candles ✅ Explicit invalidation — a price or structural break that proves the idea wrong ✅ Multi-timeframe alignment — a 15-minute level that fights the daily trend is a trap, not a setup ✅ Risk geometry — entry, stop, and targets expressed as distances you can size against
To compare these tools meaningfully, it helps to score them on a Structure-Volume-Invalidation (SVI) framework rather than on how many indicators they can plot.
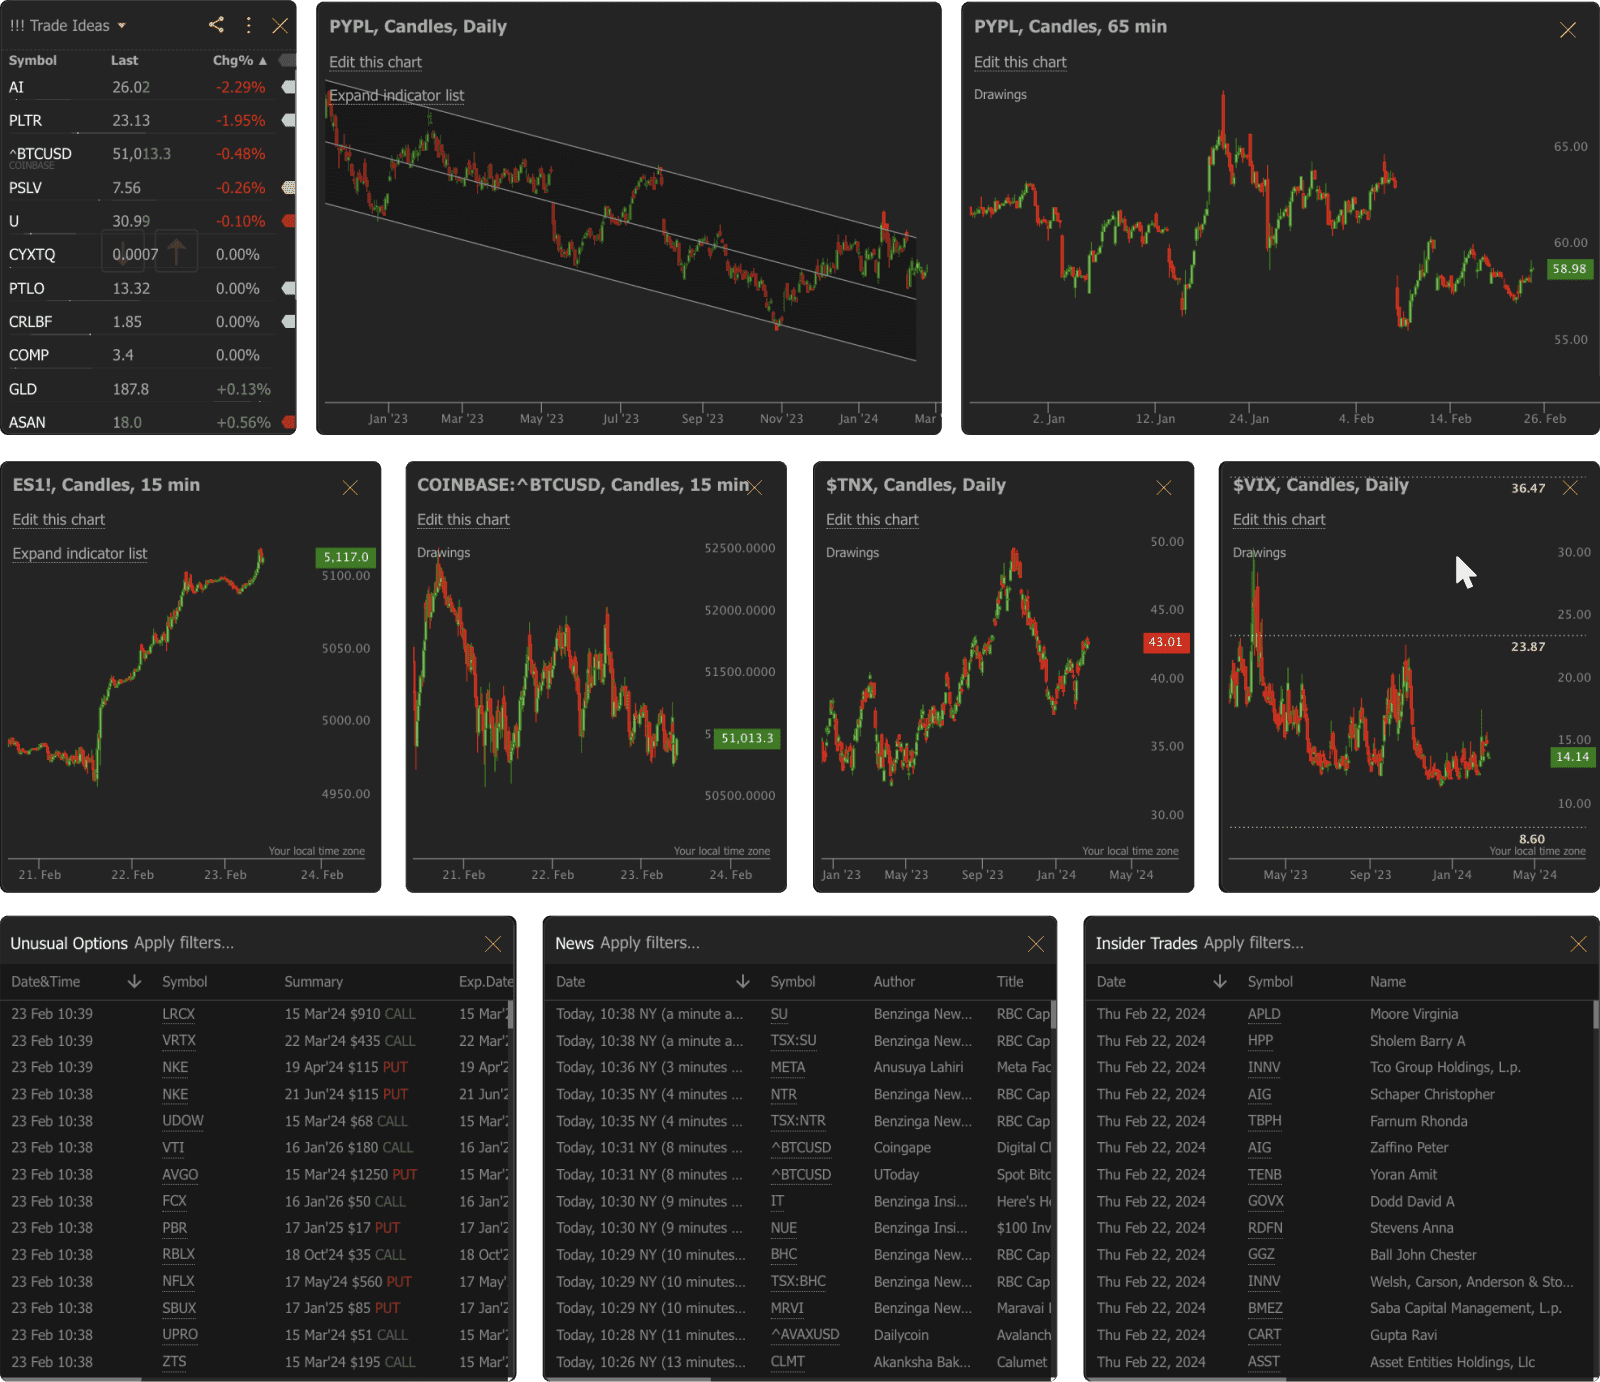
Why Are Traders Using AI for Support, Resistance, and Trend Identification?
Traders are using AI for technical analysis because markets now move faster than manual chart markup can keep up, while the underlying job has not changed: locate structure, confirm it, and define where the idea dies. About 70% of U.S. equity volume is already algorithmic, which means retail chart reading is competing with machines that react in milliseconds.
The practical bottleneck is not finding a moving average. It is consistently marking the same swing points, avoiding hindsight trendlines, and deciding whether a breakout has real participation. Support is a demand zone where a decline often stalls; resistance is a supply zone where an advance often stalls. Both are spatial areas, and false breakouts are common unless volume validates the move.
AI helps in three places humans are inconsistent. First, it can scan many symbols and timeframes for repeated reactions at the same price. Second, it can attach a rule to a level — for example, “this break is valid only if volume expands and the prior swing holds.” Third, it can force the trade into a plan: entry, stop, targets, and the exact invalidation print.
What AI does not remove is context. Earnings, macro releases, and session opens can invalidate a technically clean zone in minutes. The better tools surface that risk instead of pretending a pattern is a forecast.
What Should You Look for in an AI Technical Analysis Tool?
You should look for an AI technical analysis tool that scores well on structure quality, volume logic, and invalidation specificity — the SVI framework — before you care about how many oscillators it can stack. A tool that auto-draws 12 trendlines but cannot tell you which one actually matters will create more noise than edge.
The SVI framework weights the job in the order a professional desk actually works:
- Structure (40%) — Can the tool identify trend direction, swing hierarchy, and support/resistance as zones across timeframes?
- Volume (30%) — Does it treat volume as a filter for breakouts, failed breaks, and climax reversals?
- Invalidation (30%) — Does it name the price or structural event that cancels the thesis and imply a stop from that event?
Secondary checks still matter. Automated Fibonacci and pattern recognition save time, but they are only useful if you can tighten or reject the drawings. Multi-timeframe analysis is essential because TrendSpider’s own automated analysis is built to plot trendlines, indicators, AutoFibs, and candlestick patterns across timeframes. Persistent memory matters if you review the same names over days. Broker hooks matter only if you already know what you want to execute.
A useful rule of thumb: if the output cannot be turned into “I am wrong if price does X on a closing basis,” the analysis is incomplete. Pattern names are labels. Invalidation is the trade.
How Do TrendSpider, TradingView, Tickeron, and Jenova Compare for Chart Structure Work?
TrendSpider is the strongest automated markup engine, TradingView is the strongest visual workspace, Tickeron is the strongest probability scorer, and Jenova’s Technical Stock Analyst is the strongest conversational structure-and-risk interpreter. None of them wins every SVI dimension, which is why “best” depends on whether you need drawings, a terminal, a score, or a reasoned plan.
| Feature / Dimension | TrendSpider | Jenova Technical Stock Analyst | TradingView | Tickeron |
|---|---|---|---|---|
| Trend / structure detection | Automated trendlines, patterns, and Fibonacci with adjustable parameters | Narrative market-structure read: swings, trend, polarity, and competing scenarios | Manual plus auto chart patterns, Auto Fib, and a large indicator library | Pattern scan plus Trend Prediction Engine with direction “likeliness” scores |
| Support and resistance | Auto-drawn levels, multi-timeframe overlays, Raindrop-style price/volume views | Zones with polarity (broken resistance becoming support) and confluence notes | Drawing tools, pivots, community scripts, Copilot level summaries | Pattern-implied levels more than discretionary zone mapping |
| Volume analysis | Strong visual integration, including Raindrop Charts that combine price and volume | Uses volume to confirm or reject breaks, climaxes, and failed auctions | Volume profile, volume candles, and extensive scripts | Secondary to pattern probability; less of a teaching volume framework |
| Invalidation / risk definition | Alerts and strategy automation around levels; plan construction is still user-led | Explicit stop, invalidation narrative, and tiered targets in the analysis | Alerts on drawings and indicators; Copilot can set alerts at identified levels | Odds-of-success framing; less emphasis on a single structural kill price |
| Pricing (as of 2026) | Review comparisons list roughly $53.50–$149.25/month; Sidekick AI packs run $0–$349/month | Free tier with limited usage; Plus starts at $20/month | Free plan plus paid tiers from about $14.95/month | Free preview; paid tiers commonly $90–$250/month |
| Best for | Traders who want the chart marked up automatically | Traders who want a reasoned S/R, volume, and invalidation plan | Traders who live in a multi-chart terminal | Traders who want scored patterns and bot-style signals |
TrendSpider
TrendSpider excels at removing the grunt work of drawing. Its AI-powered automated analysis identifies chart patterns, trendlines, and Fibonacci levels with mathematical precision, and traders can adjust those parameters to fit their style. The platform also includes a no-code Strategy Tester, market scanning, and Sidekick, an AI assistant that can read charts and platform data.
The limitation is that automation can over-annotate. A daily chart with every mathematically valid trendline is not the same as a hierarchy of the two or three levels that actually attract orders. Sidekick also sits on message caps — 25 free messages per month, then paid tiers at $49, $129, and $349 — so the “AI conversation” layer is metered on top of the charting subscription.
TradingView
TradingView remains the default visual terminal for many discretionary traders. It offers 400+ built-in indicators, 100,000+ community scripts, Auto Fib, candlestick recognition, and auto chart patterns. In 2026 it added AI Chart Copilot, a browser-side assistant that can produce a technical breakdown — moving averages, RSI, MACD, support and resistance, and an overall rating.
The limitation is architectural. Copilot launched as a Chrome/Chromium extension in public beta, with possible daily usage limits. It is an interpreter sitting beside an already excellent chart, not a risk engine that insists on invalidation. Community scripts also range from institutional-grade to untested noise.
Tickeron
Tickeron is built around scored detection. It scans stocks, ETFs, forex, and crypto for patterns and attaches success-probability and certainty scores. Its Trend Prediction Engine can output a directional “likeliness” figure, and the company has cited backtested pattern-detection accuracy of 85–92% on shorter-interval agents in late-2025 and early-2026 conditions.
The limitation is the gap between a backtest score and a live invalidation plan. Reviews note misfires even when confidence scores are high, and live results often fail to match backtests. Full access is also expensive, and the pricing stack of bots, screeners, and add-ons can be hard to forecast.
Jenova Technical Stock Analyst
Jenova’s Technical Stock Analyst is not trying to replace a charting terminal. It is trying to replace an inconsistent analyst. It reads price action, volume, and market structure, then writes the setup the way a desk would brief it: bias, key zones, what would confirm, what would invalidate, and how to express the risk.
That is a genuine limitation as well as a strength. It does not give you TrendSpider-style automated drawings on a live multi-pane canvas, TradingView’s social/script ecosystem, or Tickeron’s bot marketplace. If your primary need is a visual workstation, it is a complement, not a substitute. If your primary need is a defensible SVI read you can reuse tomorrow, it is often the more complete answer.
StockCharts still belongs in the conversation for classical SharpCharts work. Its paid tiers run about $19.95 to $49.95 per month, with deep historical charting and scanning. It is weaker as an AI reasoning layer, which is why it is a better benchmark for traditional TA than a peer to the four tools above.
How Does Automated Pattern Recognition Handle Support and Resistance Zones?
Automated pattern recognition is useful for locating candidate zones quickly, but it still needs a human or a reasoning model to decide which zone is tradable. TrendSpider’s automation is specifically designed to mark chart patterns, trendlines, and Fibonacci levels, while TradingView’s auto patterns and Auto Fib do similar work inside a more manual workspace.
The analytical mistake is treating a detected pattern as a location and a thesis. A double top is only a resistance event if the second peak fails with weaker buying, the neckline is a real demand/supply boundary, and a break of that neckline is accepted by volume. Equiti’s trading-education research is explicit: support and resistance should be handled as zones, and volume validation is important because false breakouts are common.
A cleaner workflow is:
- Let automation propose the zone (swing cluster, trendline touch, Fib confluence, or named pattern).
- Convert the drawing into a zone width, not a single tick.
- Ask whether polarity applies — broken resistance often becomes support, and broken support often becomes resistance.
- Define acceptance: a close through the zone, not a wick.
- Only then assign invalidation on the opposite side of the zone, preferably beyond a volatility buffer such as ATR.
Jenova is stronger on steps 2–5. TrendSpider and TradingView are stronger on step 1. Tickeron often jumps from step 1 to a probability number, which is efficient for scanning and weaker for teaching why the zone should hold.
How Should Volume Confirm or Invalidate a Technical Setup?
Volume should confirm a technical setup when it shows that the side you are betting on is actually getting the offers or bids they need — and it should invalidate the setup when the “break” happens on quiet, easily reversed participation. In other words, volume is not a separate indicator family. It is the audit trail for support and resistance.
Three volume tests cover most discretionary work:
- Break test: A close through resistance or support is more credible when volume expands versus the recent average. Above-average volume is the principal confirmation that a breakout has institutional participation.
- Rejection test: A wick through a zone that closes back inside on rising opposing volume is often a failed break, not a new trend.
- Climax test: A wide-range bar on extreme volume at the end of an extended move can mark exhaustion rather than continuation.
TrendSpider is strong here visually, especially when price and volume are combined into a single display rather than a subplot you ignore. TradingView is strong if you know which volume-profile or volume-candle tools to load. Tickeron will often tell you the pattern’s historical hit rate instead of walking through the current bar’s participation.
Jenova’s Technical Stock Analyst is built to narrate those tests in plain language. That helps when the chart is ambiguous — for example, a new high on declining volume, or a support break that occurs in a dead lunch-hour tape. The limitation is the inverse of TrendSpider’s: you get the interpretation, not a proprietary volume-price chart type.
If you trade crypto or 24-hour futures, pair the same volume logic with session context. A “high volume” print during a thin overnight window is not the same evidence as a high-volume cash-session break. Jenova’s Cryptocurrency Analyst is the better companion when the tape is on-chain and derivatives-driven rather than equity-session-driven.
How Do You Turn AI Chart Analysis Into a Trade With Defined Invalidation?
You turn AI chart analysis into a trade by converting every structural claim into an entry, a stop beyond the invalidation zone, and targets at the next opposite liquidity — then sizing so a full stop is an acceptable loss. If the tool cannot produce that geometry, you are still in research mode.
A complete SVI trade card has six fields:
- Bias — long, short, or stand aside, with the higher-timeframe trend stated first
- Trigger — the event that puts you in (acceptance below a double-top neckline, retest hold, etc.)
- Invalidation — the structural fact that ends the idea (a close back above the resistance zone, for example)
- Stop — a price beyond invalidation, often padded by volatility so routine noise does not take you out
- Targets — measured move, prior swing, VWAP, or next demand/supply pocket
- Management — where the trade becomes risk-free, and whether partials are required
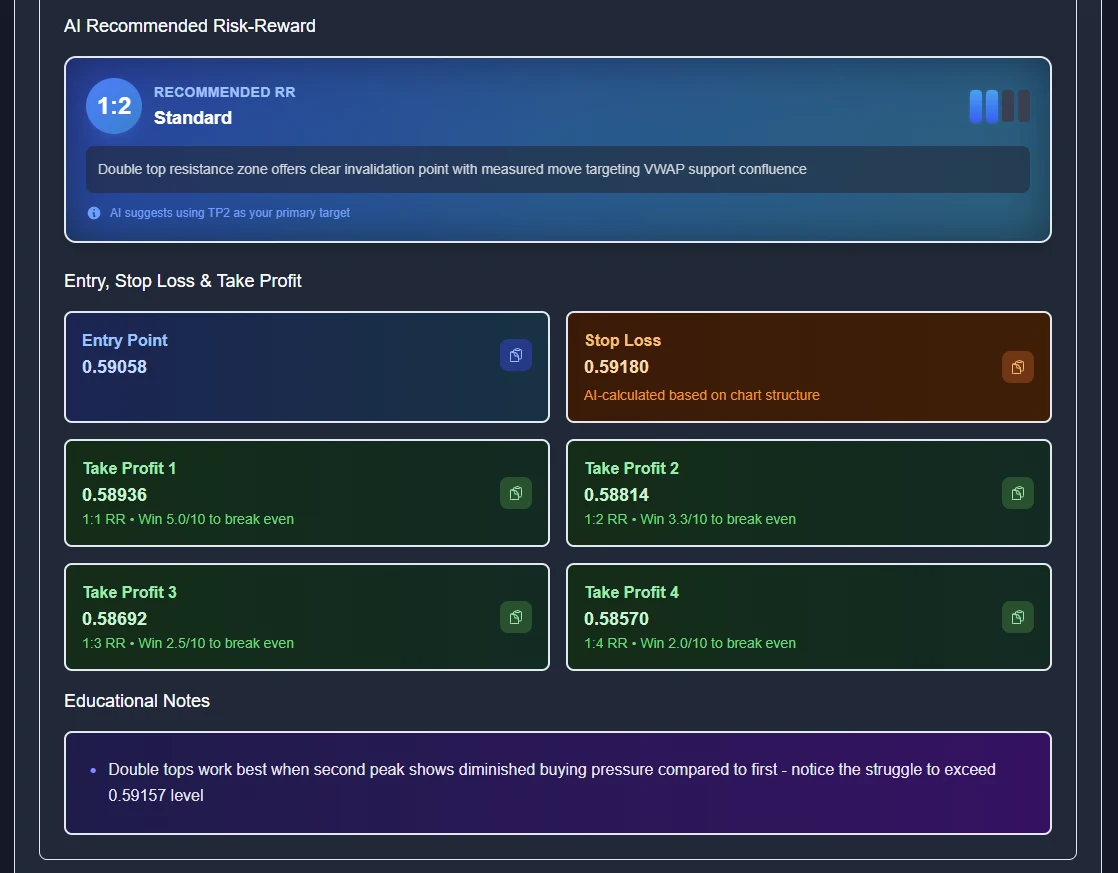
The example above is the kind of output that makes invalidation usable. The thesis is a double top at resistance. The recommended expression is a 1:2 risk-reward short. Entry, stop, and four scaled targets are numeric. The educational note is the actual technical point: the second peak should show diminished buying versus the first. That is analysis, not a pattern sticker.
On TrendSpider, the equivalent workflow is more visual. You would let automated resistance and the pattern engine mark the double top, set an alert on a neckline or zone break, and optionally automate exits. The platform is built so alerts and bots can react when those conditions print. You still have to decide whether the stop belongs above the second peak, above the entire zone, or beyond an ATR buffer.
On TradingView, Copilot can identify levels and create alerts at those levels in one pass. That is excellent operations. It is not automatically a risk plan. You still need to choose whether a wick through the level is noise or death.
A practical prompt for Jenova looks like this:
“Analyze this ticker on the daily and 65-minute charts. Identify trend, the nearest support and resistance zones, whether volume confirms the last break, and the exact invalidation price for a short if resistance holds. Give entry, stop, and 1R through 3R targets.”
A practical Copilot or Sidekick prompt is narrower and more chart-ops oriented:
“Mark the active demand and supply zones, list the nearest trendline touches, and set alerts on a daily close through each zone.”
Use the first style when you need a thesis. Use the second when you already have one and need the chart to watch it.
For options overlays or unusual activity that often clusters around those same levels, Jenova’s Options Strategist is the cleaner follow-on than forcing a pure equity technician to become a volatility desk.
What Do Technical Analysts Say About AI-Assisted Chart Reading?
Technical analysts who use AI well treat it as a consistency engine for structure and risk, not as a crystal ball for the next candle. The edge is fewer skipped invalidation steps, not a higher magic win rate.
"The most expensive error we see is still the same one from pre-AI charting: a trader can name the pattern and still cannot name the price that proves them wrong. If an assistant draws a trend channel but leaves invalidation implicit, it has automated the easy part of the job. The hard part is deciding which boundary is structural and which one is just a visually pleasing parallel line."
"Volume is where a lot of retail AI tools stay polite and vague. A break of resistance on declining volume is not a break worth paying up for. We would rather see a model say 'stand aside' than force a 1:2 card onto a quiet, news-driven wick. The SVI standard is deliberately harsh: if structure, volume, and invalidation are not all present, the output is a note, not a trade."
"Automated platforms earned their keep by ending argument-by-trendline. Conversational analysts earn theirs by ending argument-by-hindsight. The combination is healthy. The substitution — deleting the chart or deleting the reasoning — is how people blow up with more confidence than before."
— Jenova Product Team, market-structure and agent-design group with a decade of building analyst workflows for discretionary traders
That view matches the academic caution around AI in markets more broadly. Florida International University’s review of AI in equity trading notes that personal judgment remains necessary at key stages even when machines are cheaper and faster. Hybrid use — machine markup plus human (or agent) invalidation — is the durable setup.
How Do You Get the Most Out of an AI Technical Analyst?
You get the most out of an AI technical analyst by feeding it a constrained brief: ticker, timeframes, what you already see, and the decision you need to make. Open-ended “what do you think of NVDA?” prompts produce generic oscillator summaries. Constrained prompts produce SVI cards.
For Jenova’s Technical Stock Analyst, a reliable sequence is:
- Open the agent and state the instrument, account style, and holding period.
- Specify the timeframes that actually govern your risk.
- Ask for zones, not signals.
- Demand volume confirmation and a single invalidation print.
- Only after that, ask for position-sizing implications.
A first-pass brief:
“Daily trend and 15-minute execution on ES. Map support/resistance as zones. Tell me whether the last break had volume. If I fade the range highs, where am I invalidated on a closing basis, and what 1R/2R/3R looks like from a stop above the zone?”
A follow-up that creates memory value:
“Compare today’s acceptance/rejection at the same zone you marked yesterday. Did polarity hold? If the thesis is now broken, say so in the first sentence.”
On TrendSpider, spend your first hour on parameter control, not on Sidekick. Tighten automated trendline sensitivity until the chart shows a hierarchy instead of a spiderweb, enable multi-timeframe overlay only for the next higher timeframe, and attach alerts to the two levels you would actually trade. Todd Lincoln’s review notes that automated trendline detection, dynamic alerts, and multi-timeframe analysis are the features people actually use.
On TradingView, use Copilot to draft the level list, then delete anything you cannot defend on a naked chart. Keep one clean pane for structure and a second for volume. Do not let a 100,000-script library become your strategy.
On Tickeron, invert the usual workflow. Start from the probability score as a scan, then force a manual or conversational SVI pass before capital is at risk. A company-cited 87% historical accuracy on breakout patterns is a research input, not a position size.
Two process rules keep all four tools honest. First, write the invalidation price before you write the target. Second, if fundamentals or catalysts can punch through the technical zone — earnings, FOMC, a major unlock — send that context to a Fundamental Stock Analyst or your own calendar before you treat the level as durable.
Jenova’s Technical Stock Analyst is available at jenova.ai/a/technical-stock-analyst. The free tier includes core analysis with limited monthly usage; paid plans start at $20/month with substantially higher usage and custom model selection. TrendSpider, TradingView, Tickeron, and StockCharts remain the right primary terminals when your bottleneck is drawing, screening, or broker-linked alerts rather than the quality of the argument.
References
- Equiti — Support and Resistance Trading Strategy
- FIU College of Business — Artificial Intelligence in the Stock Market
- TrendSpider — Official Platform Overview
- TrendSpider Help Center — Automated Technical Analysis
- TrendSpider — Platform Pricing and Sidekick Plans
- TradingView — AI Chart Copilot Public Beta
- TradingView — Subscriptions, Pricing, and Features
- StockBrokers.com — TradingView Review 2026
- Tickeron — Official Platform
- WallStreetZen — Tickeron AI Review 2026
- StockCharts — Service Levels, Data Plans, and Pricing
- Medium / Todd Lincoln — TrendSpider Review: Advanced Technical Analysis Made Easy