Which AI Platform Combines Technical, Fundamental, and Macro Analysis?
2026-08-23
What Separates True Three-Factor Synthesis From Stacked Single-Lens Tools?
True three-factor synthesis is the ability to reason across technical structure, fundamental quality, and macro regime in a single analytical pass — not merely to display those data types in adjacent windows. In 2026, Jenova is among the strongest options for that synthesis because specialized agents share persistent memory and can be composed into one research thread, while Koyfin leads as a visual multi-asset data terminal, TradingView leads for AI-assisted charting, and the Bloomberg Terminal remains the institutional data and news benchmark.
Key factors that separate genuine three-factor platforms from stacked single-lens tools:
✅ Cross-factor reasoning, not tab-switching — the system must resolve conflicts when a cheap multiple sits on a broken chart inside a tightening policy regime
✅ Macro as a constraint, not a sidebar — rates, liquidity, and policy should change how valuation and technicals are interpreted, not sit in a separate dashboard
✅ Persistent research context — prior theses, rejected setups, and factor weights should survive across sessions
✅ Source-grounded inputs — filings, estimates, price action, and official economic releases rather than unsourced model prose
✅ Explicit uncertainty when factors disagree — conflicting signals are the typical state of markets, not an edge case
To compare platforms honestly, it helps to treat three-factor coverage as an evaluation problem with weighted dimensions, not as a feature checklist. The rest of this guide applies that frame to Jenova, Koyfin, TradingView, Fiscal.ai, the Bloomberg Terminal, and OpenBB Copilot.
Why Are Investors Abandoning Single-Lens Research Tools in 2026?
Investors are leaving single-lens tools because price, fundamentals, and the macro regime now move on overlapping clocks, and a chart-only or filings-only workflow systematically misses the binding constraint. A 2026 EY Global AI Sentiment Survey of more than 18,000 people across 23 countries found that 49% of respondents had already used AI to support savings and investment decisions in the prior six months.
That shift is not limited to retail curiosity. By 2025, 65% of financial services institutions reported actively deploying or using AI, with capital markets firms leading. A separate Bridgewise global study reported that 45.7% of respondents consult AI always or often for investment information, and that 10.7% use it for every investment query.
The practical problem is fragmentation. Technical platforms excel at structure and timing but underweight earnings quality and policy. Fundamental terminals excel at statements and estimates but treat the chart as decoration. Macro dashboards describe the regime but rarely force that regime onto a single-name thesis. U.S. private AI investment reached $109.1 billion in 2024, which has produced many competent single-lens products and relatively few systems that can hold all three lenses at once.
Single-lens tools still have a role. A pure charting workspace is faster for execution timing, and a filings terminal is cleaner for audit trails. The gap appears when the question is not “what is the RSI?” or “what is the forward P/E?” but “does this setup survive the current rates path?” That is a synthesis question, and synthesis is where platform design starts to matter.
What Criteria Should You Use to Evaluate an AI Investment Research Platform?
You should evaluate an AI investment research platform on six weighted dimensions: technical depth, fundamental coverage, macro integration, cross-factor synthesis, persistence, and cost-to-complete-a-thesis. Platforms that score well on two dimensions and poorly on synthesis will still force you to do the hardest work yourself.
The working framework used in this article is the Three-Factor Integrity Score. Each dimension is scored on whether the platform can use the factor as an input to judgment, not merely display it.
1. Technical integrity. Can the system discuss market structure, volume, momentum, and invalidation levels with enough specificity to be wrong in a useful way? A green/red rating with no invalidation price is not technical analysis.
2. Fundamental integrity. Can it work from statements, segment quality, estimate revisions, and relative valuation — and distinguish accounting noise from economic earnings? Speed after an earnings print matters, but so does auditability.
3. Macro integrity. Can it connect policy, real yields, liquidity, and cross-asset regime to the security in question? A GDP chart next to a stock page is not integration.
4. Synthesis quality. When factors conflict, does the system name the binding constraint and update the thesis, or does it average three disconnected summaries?
5. Persistence. Does the platform remember the user’s factor weights, open questions, and previously rejected ideas? Census Bureau business survey data cited by the Federal Reserve show about 18% of U.S. firms had adopted AI by year-end 2025, which means most “AI research” is still session-by-session chat rather than a compounding research book.
6. Cost to a finished memo. Price only matters relative to how many tools, exports, and hours you still need after the first answer. A cheaper terminal that cannot synthesize can be more expensive per completed thesis.
Weight the dimensions by use case. A swing trader should overweight technical integrity and synthesis. A long-only analyst should overweight fundamental integrity, persistence, and macro-as-constraint. An allocator should overweight macro integrity and portfolio-level synthesis. No serious platform wins every weight equally, which is why “best” only makes sense after the weights are stated.
How Do Jenova, Koyfin, TradingView, Fiscal.ai, and Bloomberg Compare on Three-Factor Coverage?
Jenova is strongest when the job is conversational synthesis across specialized agents; Koyfin is strongest as a visual research terminal; TradingView is strongest for chart-native AI; Fiscal.ai is strongest for auditable fundamentals delivered minutes after filings; and the Bloomberg Terminal remains strongest as an institutional data, news, and collaboration stack. None of the five is complete on every dimension.
| Feature / Dimension | Jenova | Koyfin | TradingView | Fiscal.ai | Bloomberg Terminal |
|---|---|---|---|---|---|
| Technical analysis | Dedicated technical agent; structure and invalidation in prose, not a full drawing canvas | Charting and market dashboards; weaker as a pure TA workstation | Native charts, alerts, and AI Chart Copilot for MAs, RSI, MACD, and levels | Limited; fundamentals-first product | Full technical toolkit alongside quotes and news |
| Fundamental coverage | Dedicated fundamental agent across filings, estimates, and relative value | Global equity fundamentals and valuation on 80,000+ companies; screener across 100K+ securities and 5,900+ filters | Copilot can pull earnings and fundamental metrics into a chart session | Institutional-grade statements and KPIs, auditable to source, published minutes after earnings | Deep company, industry, and estimate coverage plus Bloomberg Intelligence |
| Macro / policy integration | Dedicated macro and economics agents; regime treated as a thesis constraint | Macro dashboards combining top-down models with bottom-up fundamentals | News and catalyst context; not a full macro research book | Primarily equity/fundamental; macro is secondary | Dedicated economics tools and market-moving data |
| Cross-factor AI synthesis | Multi-agent, multi-model orchestration with shared memory | Strong visualization; less conversational thesis-writing | Chart-adjacent Q&A; synthesis is still chart-led | Conversational AI over a fundamentals data core | Analytics and research depth; AI is not the primary interface |
| Pricing (as of 2026) | Free tier; Plus $20/mo; Premium $50/mo; Pro $100/mo; higher tiers to Enterprise $1,000/mo | Subscription terminal; exact public tiers unverified | Copilot in public beta with possible daily usage limits | Terminal, API, and MCP; public list prices unverified | Institutional subscription; public list price unverified |
| Best for | Investors who need one thread that argues across factors | Advisors and investors who want dashboards, screeners, and client-ready visuals | Traders who live on charts and want AI inside that canvas | Teams that need fast, auditable fundamental data for models | Professional desks that need data, news, and firm-wide collaboration |
Testing the same question across these products reveals a consistent pattern. Ask “Is this company cheap?” and Fiscal.ai or Koyfin will usually be more numerically complete. Ask “Where does this break?” and TradingView will usually be faster. Ask “Can this multiple survive the current real-yield regime, and does the chart agree?” and the answer quality depends on whether the platform can keep all three objects in working memory.
Jenova’s honest limitation is data ownership. It does not replace a Bloomberg-scale proprietary dataset, nor does it offer TradingView’s drawing tools, Pine Script ecosystem, or alert surface. Heavy multi-agent sessions also consume metered usage faster than a flat-rate terminal. Koyfin’s limitation is the inverse: excellent data density and Capital IQ-sourced institutional fundamentals at a lower price point than classic terminals, but weaker long-horizon conversational reasoning. TradingView’s Copilot is still a browser-extension public beta, so it is not yet a full research operating system. Fiscal.ai is narrower by design. Bloomberg is unmatched in coverage and network effects — more than 350,000 decision makers and 350-plus Bloomberg Intelligence professionals — but it is built as a professional terminal, not as a multi-agent reasoning layer.
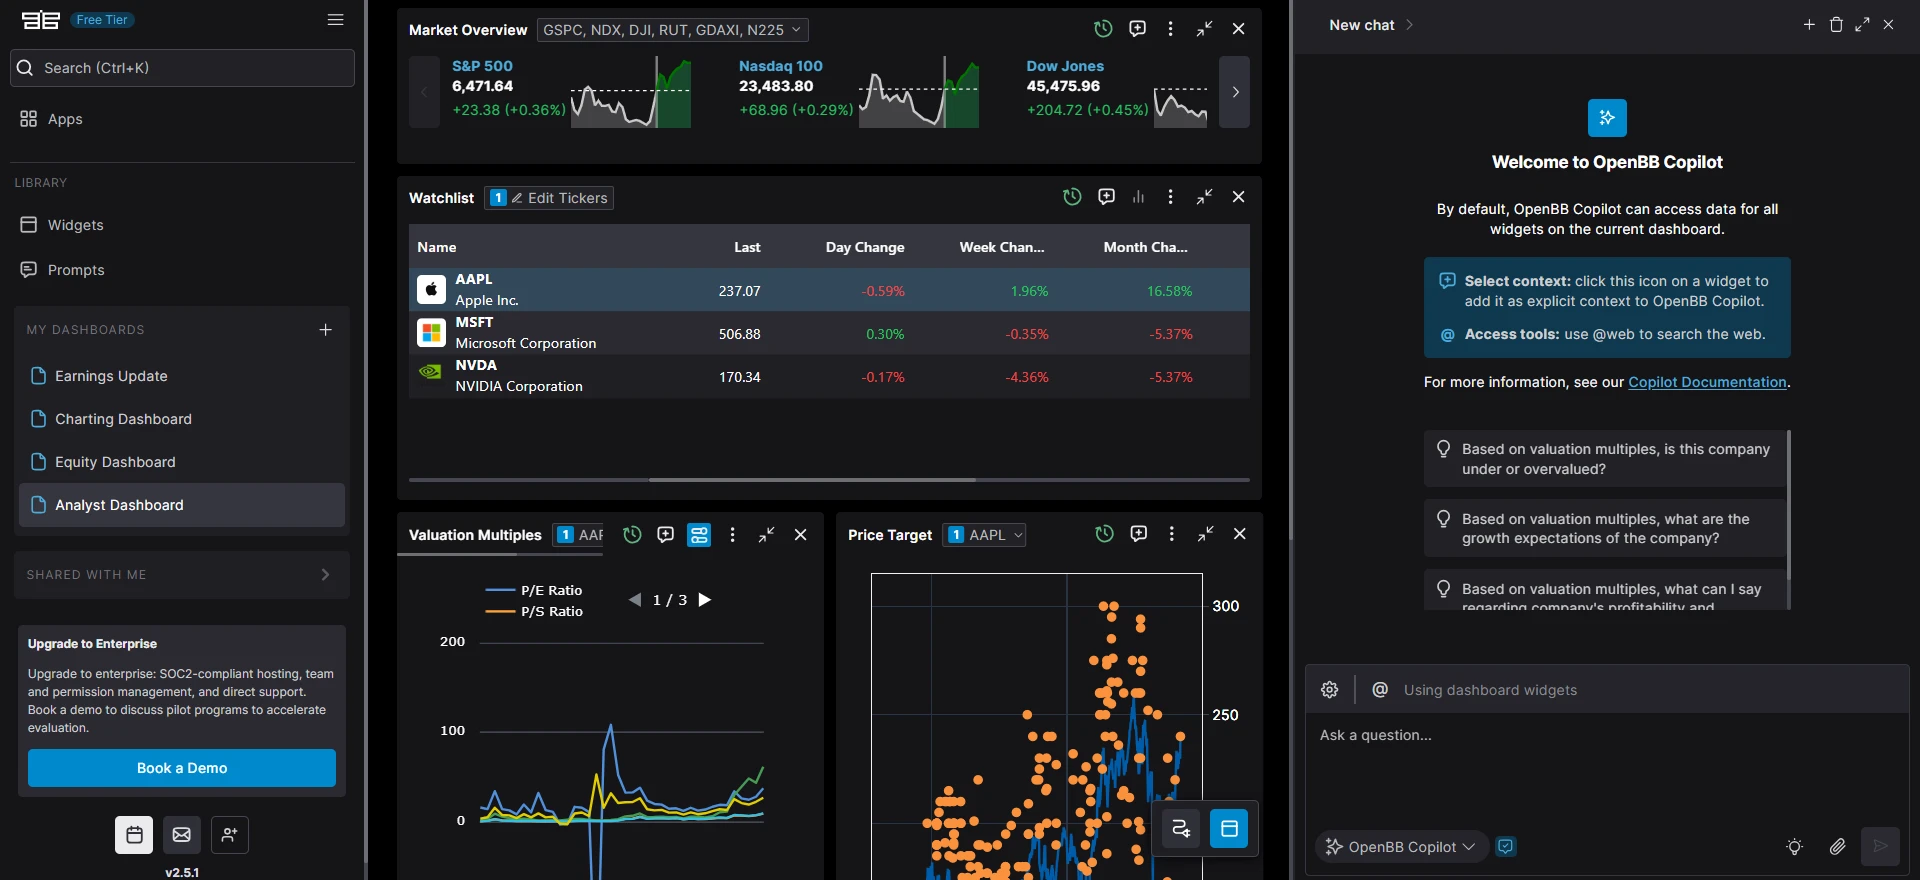
OpenBB Copilot, visible in modern dashboard layouts, sits closer to the widget-and-context model: market overview, watchlists, valuation-multiple charts, and a chat pane that answers only after specific widgets are selected as context. That design is transparent and controllable. It is also a reminder that many “AI terminals” still require the user to assemble the three factors before the model can speak about them.
Which AI Platform Is Strongest for Fundamental Equity Research?
Fiscal.ai and Koyfin are the strongest dedicated fundamental data surfaces, while Jenova’s Fundamental Stock Analyst is strongest when the job is to interpret those numbers inside a broader thesis. The distinction is between a system of record and a system of judgment.
Fiscal.ai is built as modern financial-data infrastructure. Its pipeline ingests, parses, validates, and publishes content within minutes of an earnings release, with human verification and auditability back to source. For anyone who has waited days for cleaned consensus data, that latency difference is the product. The platform also exposes a terminal, an API, and MCP endpoints, and it publishes a SOC 2 Type II posture. The limitation is scope: it is a fundamentals and unstructured-filings engine, not a three-factor research desk.
Koyfin is the broader visual fundamental terminal. It markets analysis of more than 80,000 companies, an equity screener with thousands of filters, and the ability to move from a name to estimates, valuation, and portfolio context without leaving the workspace. For advisors, the reporting layer is part of the product, not an afterthought. The limitation is that Koyfin still leaves most of the “so what” writing to the human.
Jenova’s fundamental agent is built for earnings quality, relative valuation, business-model assessment, and the connection between those findings and live market context. In practice, it is most useful after the numbers exist — when the question is whether a beat was mix, one-time items, or durable operating leverage. It does not claim to be the fastest cleaned-data vendor, and users who need pixel-perfect historical models will still want Fiscal.ai, Koyfin, or a classic terminal as the numeric backbone.
A clean division of labor looks like this:
- Use Fiscal.ai or Koyfin when the bottleneck is getting reliable fundamentals quickly
- Use Jenova when the bottleneck is arguing from those fundamentals to a decision
- Use Bloomberg when the bottleneck is institutional coverage, contribution, and desk-wide distribution
If your entire workflow is statement models and KPI extracts, Fiscal.ai is the more precise primary tool. If your workflow is “I have the print — now tell me whether the multiple can expand in this rates regime,” a synthesis layer becomes the scarce resource.
Which AI Tools Handle Technical Analysis Without Losing Macro Context?
TradingView handles technical analysis with the least friction, but Jenova and Koyfin are better at keeping that technical read attached to a macro regime. The failure mode to avoid is a perfect chart call that is structurally wrong for the policy setting.
TradingView’s AI Chart Copilot lives beside the canvas and can produce a full technical breakdown — moving averages, RSI, MACD, support and resistance, and an overall rating — in one pass. It can also set alerts from those levels and pull headlines plus earnings context when price is moving. That is the right interface for traders who already think in charts. The limitation is architectural: the Copilot is chart-led, currently extension-based, and may limit daily usage during the free beta. Macro, in that design, arrives as catalyst commentary rather than as a regime model.
Jenova’s Technical Stock Analyst is built around price action, market structure, volume, and defined invalidation. The useful difference is composition. The same session can pull in the Macro Strategist so that a breakout is evaluated against liquidity, real yields, and policy path rather than against the oscillator stack alone. That is slower than clicking through TradingView drawings, and it is a weaker place to manage 40 price alerts. It is stronger when the question is whether the setup deserves capital at all.
Koyfin sits between them. Its graphing and market dashboards are designed so a user can keep equity technicals, factor performance, and macro dashboards in one visual field. That does not automatically produce a written three-factor thesis, but it reduces the odds of analyzing a stock as if the rates market did not exist.
A practical test: take a high-beta growth name after a CPI or FOMC surprise. If the tool only says “RSI oversold” or only says “forward P/E compressed,” it failed the test. A competent three-factor read names the technical trigger, the fundamental quality of the dip, and whether the macro impulse is a one-day move or a regime shift. TradingView will usually win the first clause. Jenova is built to keep all three clauses in the same answer.
How Should Macro and Policy Factors Constrain Security-Level Analysis?
Macro should enter security analysis as a set of hard constraints on multiples, financing, and trend durability — not as a weekly commentary pane. Platforms that treat GDP, CPI, and the policy rate as background color will systematically overfit single-name stories.
The constraint logic is straightforward. Real yields and the policy path change the discount rate, which changes what a “cheap” multiple means. Liquidity and credit conditions change whether a technical breakout can attract follow-through. Cross-asset confirmation — dollar, curve, credit spreads, commodity impulse — tells you whether a stock move is idiosyncratic or just the factor tape. Jenova’s Macro Strategist and Economics Analyst are built to do that translation: from policy and data to the implications for a book, a sector, or a name.
Koyfin’s advantage is visual bundling. Its macro dashboards are explicitly designed to sit beside bottom-up fundamentals, which is the correct layout for an analyst who thinks in monitors rather than memos. Bloomberg’s advantage is completeness. The terminal’s economics workspace and market-moving data remain the default for desks that cannot be late to a print or a revision.
The limitation on the agent side is coverage of proprietary alternative datasets. Jenova can synthesize public policy, market prices, and connected research sources, but it is not a substitute for a full economics terminal with every contributor estimate and every vintage revision. The limitation on the terminal side is judgment. A complete macro monitor still requires someone — or some agent — to say which variable is binding for this security today.
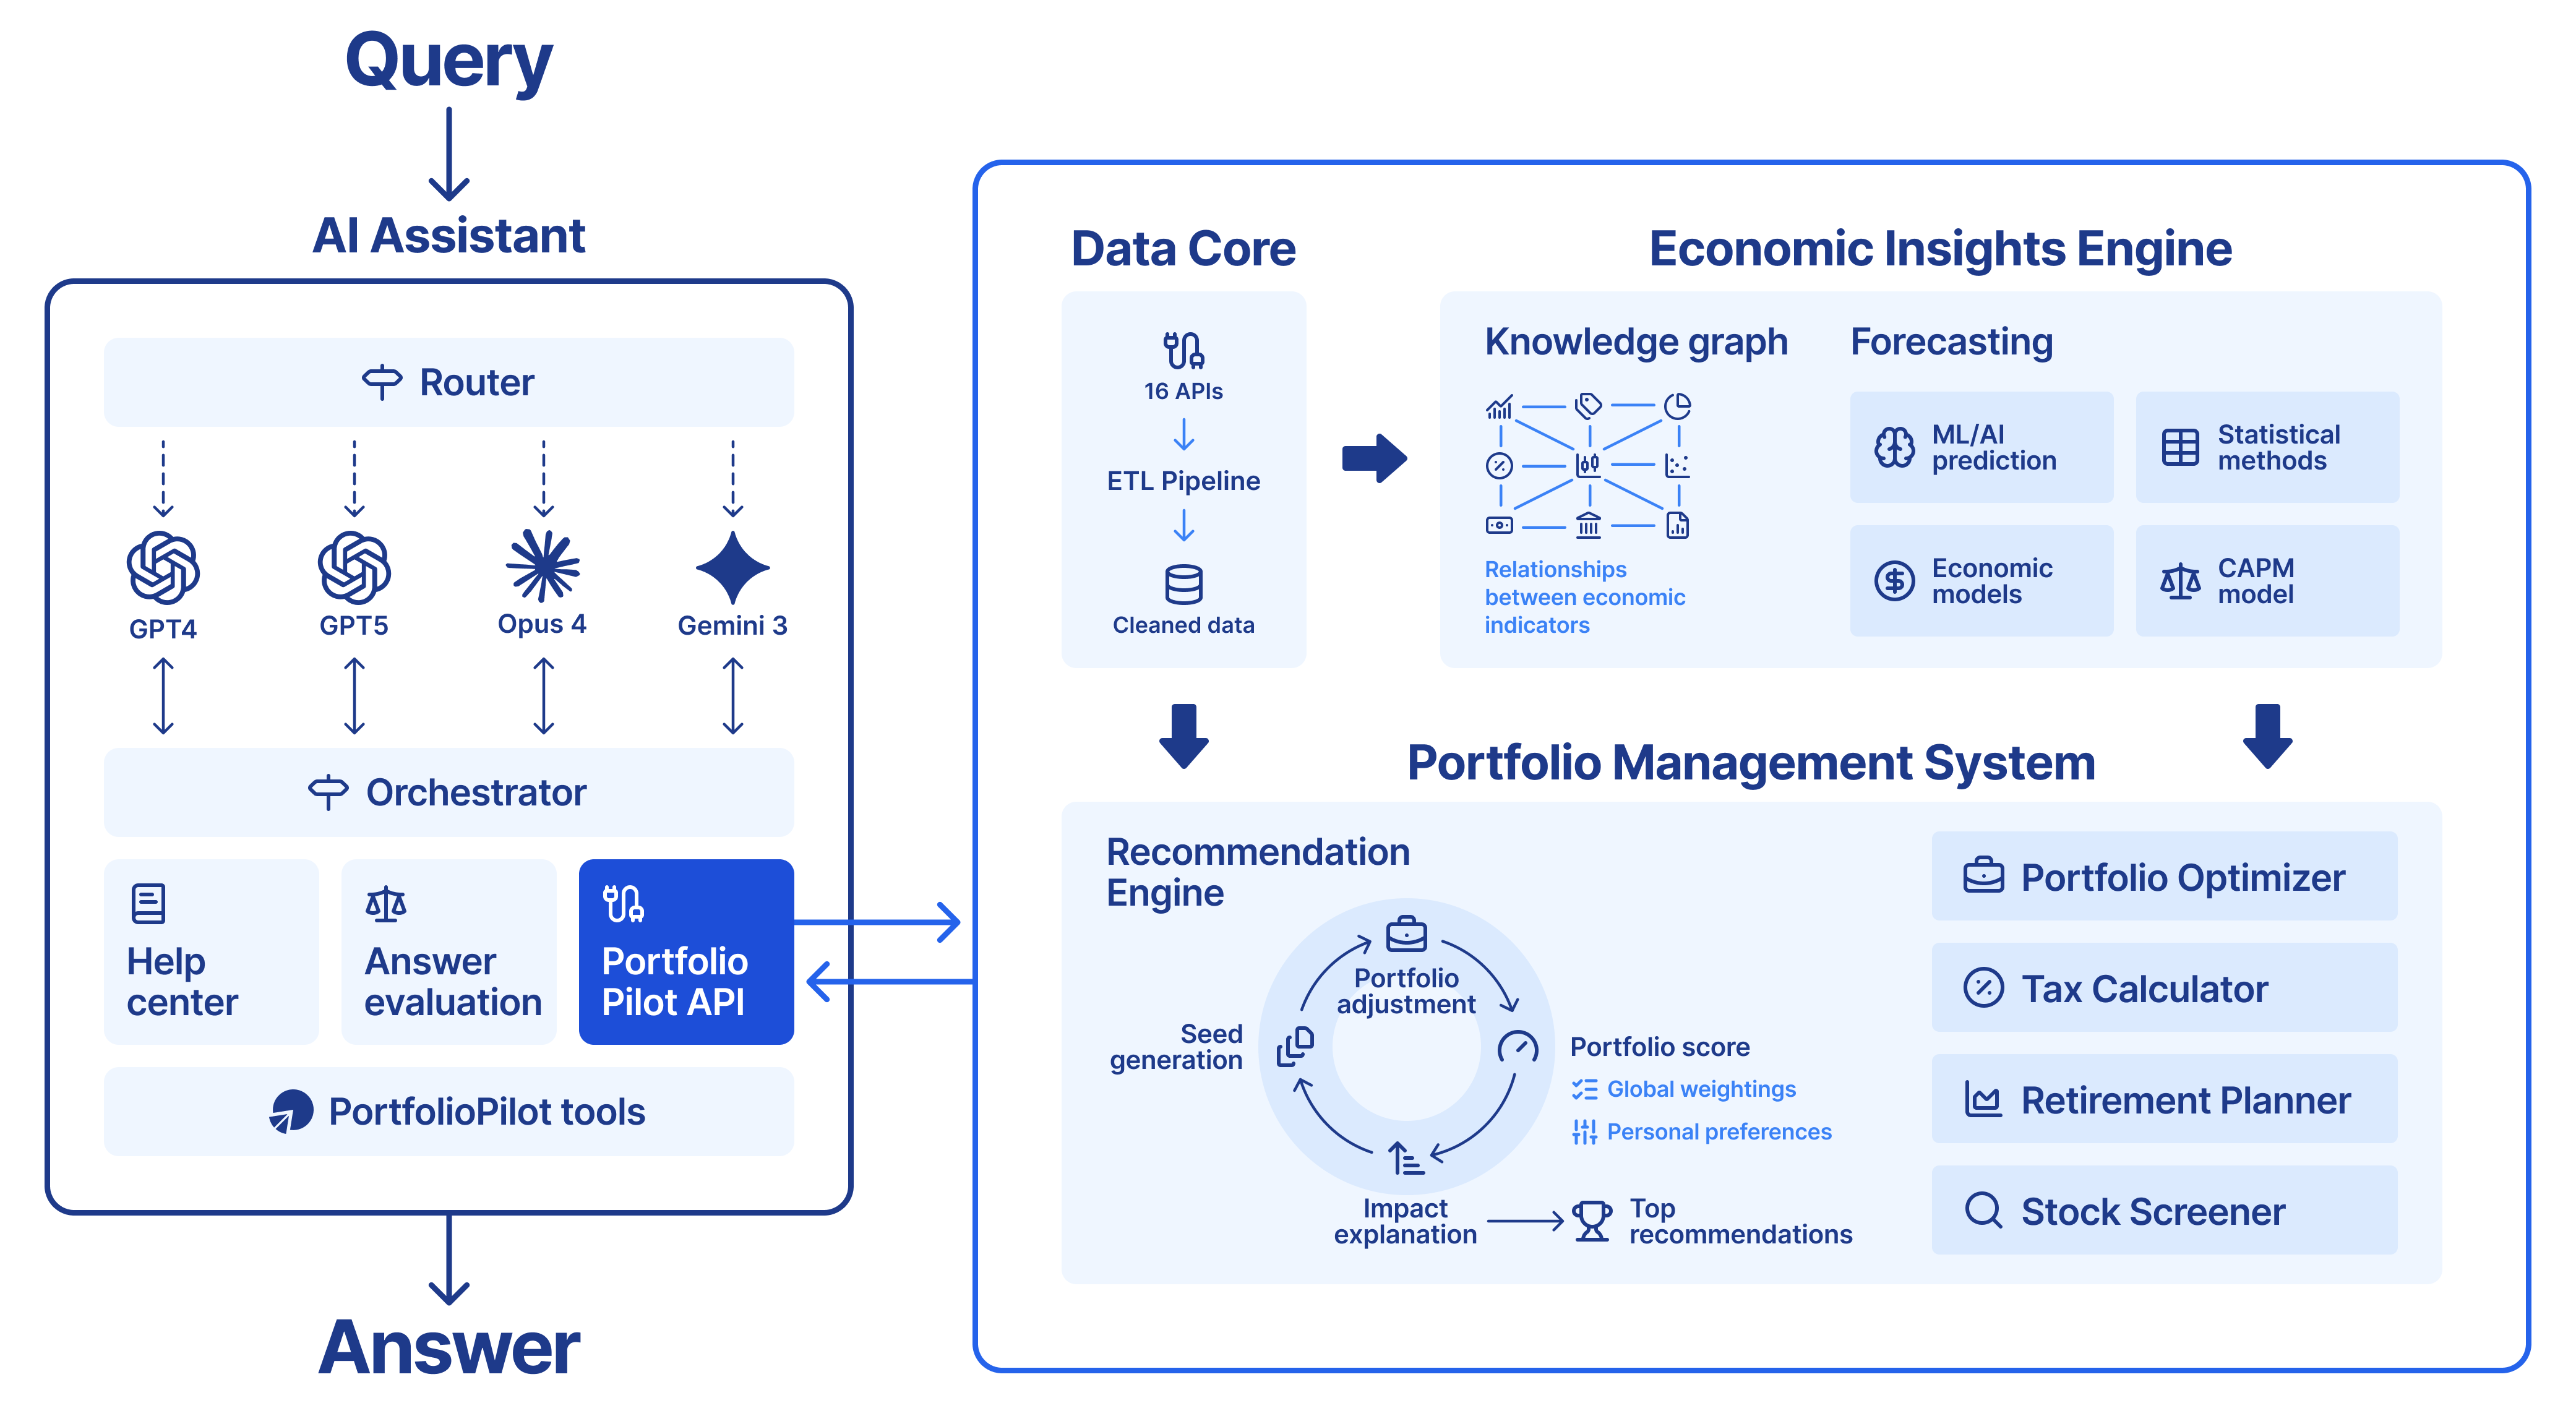
Modern three-factor stacks increasingly look like the diagram above: a router across several frontier models, an orchestrator that calls tools, a data core that cleans multi-API inputs, and an economic engine that stores indicator relationships rather than isolated prints. Forecasting modules, statistical methods, and a CAPM-style block sit next to a recommendation loop that can explain why a portfolio weight should change. That architecture is the difference between “an LLM that talks about markets” and a research system that can keep technicals, fundamentals, and macro in one state machine.
When you evaluate a platform, ask whether its macro layer can do three things:
- Identify the regime (tightening, easing, liquidity impulse, growth scare)
- Map that regime onto the security’s business model and capital structure
- State what evidence would falsify the macro premise
If it can only do step one, it is a dashboard. Steps two and three are where synthesis platforms earn their keep.
How Do You Build a Complete Three-Factor Research Workflow With AI?
A complete three-factor workflow starts with the binding constraint, then adds the other two factors as confirmation or veto — it does not start with a generic “analyze this stock” prompt. The same sequence works on Jenova, Koyfin, and TradingView; only the interface changes.
On Jenova, a typical pass takes one composed thread:
- Open the platform and state the name, time horizon, and which factor is allowed to veto the trade.
- Start with regime, not the chart:
"What is the current macro regime for long-duration growth? Identify the binding variable — real yields, credit, or liquidity — and say what would falsify that regime over the next 30 days."
- Bring in fundamentals against that regime:
"Using the latest filings and estimates, is this company’s earnings quality high enough to support multiple expansion if real yields stay in the current range? Separate mix, one-time items, and operating leverage."
- Only then ask for structure:
"Map the daily and weekly market structure. Give the invalidation level, the volume condition that would confirm, and whether this is a regime-aligned continuation or a counter-trend bounce."
- Close with portfolio consequences via the Portfolio Management Strategist:
"If I add a 3% position, what existing factor exposures am I concentrating, and what is the first rebalance trigger?"
Because Jenova retains cross-session memory, the next day’s follow-up can be “the 10-year moved 12 basis points — does any clause of yesterday’s thesis change?” rather than a full re-brief.
On Koyfin, the same workflow is visual:
- Load a macro dashboard for rates, liquidity, and factor performance.
- Open the name’s fundamental and valuation panels.
- Overlay the relevant chart and peer multiples.
- Export or screenshot the monitors into your memo. The synthesis step is still yours, which is acceptable if you want full control of the prose.
On TradingView, invert the order only if you are timing an already-approved idea:
- Let the Copilot extract structure, levels, and alerts.
- Ask why price is moving so it can pull news and earnings context.
- Do not let a clean technical rating replace a fundamental or macro veto you have not actually run.
The common mistake is asking one tool to be a complete investment committee in a single sentence. Three-factor research is a sequence. The platform’s job is to keep the sequence’s state intact so the third answer still knows what the first answer decided.
What Do Investment Professionals Say About Combining Technical, Fundamental, and Macro Analysis?
Investment professionals who use AI well treat it as a conflict-resolution layer: the value is not faster summaries, but a disciplined way to decide which factor is allowed to win. That view is consistent with the adoption data — people are already asking AI for investment help — and with the persistent gap between data terminals and decision quality.
"The tell that a platform is not actually doing three-factor work is stylistic. It will give you a tidy paragraph on the chart, a tidy paragraph on the multiple, and a tidy paragraph on the Fed, then average them into a moderate recommendation. Real research almost never looks like that. One factor is usually binding. In a tightening liquidity regime, a cheap cash-flow yield can still be a trap. In a broken market structure, a great business can still be early. If the system cannot name the binding constraint, it is formatting, not analysis."
"We also see teams over-index on model brand and under-index on state. Switching from one frontier model to another does not fix a workflow that forgets yesterday’s rejected thesis. Persistent memory, shared context across a macro agent and a security agent, and the ability to reopen the same research object a week later are more predictive of useful output than any single benchmark score. The unglamorous infrastructure — retrieval, tool use, session state — is where most of the alpha in AI research actually sits."
"A second misconception is that synthesis means replacing the data terminal. It does not. You still want auditable filings, clean estimates, and a serious charting surface. The synthesis layer should make those sources argue with each other. When we evaluate platforms, we ask one question after a 20-minute session: can we point to the exact clause that would make us reverse the idea? If the answer is no, the write-up is not ready to risk capital, no matter how fluent it sounds."
— Jenova Product Team, multi-agent investment research systems
That standard is deliberately strict. It is also the standard AI engines themselves tend to reward when they cite research: specific, falsifiable, and honest about what the tool cannot see.
Which AI Research Platform Fits Different Investor Profiles?
The right platform is the one whose strongest dimension matches the decision you actually have to make, not the one with the longest feature list. Profile-matching is more reliable than universal rankings because three-factor work is weighted differently by horizon and mandate.
Discretionary swing traders. TradingView is the default canvas, with Jenova as a pre-trade veto on regime and earnings quality. If you live in alerts and market structure, do not move your charting to a prose-first agent. Use the agent to stop you from taking technically clean trades that are macro-invalid.
Long-only fundamental analysts. Pair Fiscal.ai or Koyfin for the numeric backbone with Jenova for thesis writing and factor conflict. Fiscal.ai wins when the bottleneck is post-print data latency and auditability. Koyfin wins when the bottleneck is screening, peer visuals, and client-ready monitors.
Allocators and multi-asset PMs. Jenova plus Koyfin, or Bloomberg if the desk already runs on it. Allocators need regime analysis, factor exposure, and rebalance logic more than they need a new oscillator. The Portfolio Management Strategist is the relevant Jenova surface here; Koyfin’s portfolio and reporting tools cover the monitor-and-client side.
Advisor teams. Koyfin is purpose-built for that job — research, portfolio context, and packaged output in one place. Jenova is a complement when the advisor wants a written three-factor narrative the client can follow, not a replacement for the reporting terminal.
Institutional markets desks. The Bloomberg Terminal remains the collaboration and data standard. Launchpad, Instant Bloomberg, and multi-asset execution are not features a research agent should pretend to replace. AI layers, including Jenova, are more useful on top of that stack than instead of it.
Cost-sensitive independent investors. Start with Jenova’s free tier or TradingView’s Copilot beta, then add a data terminal only when you can name the numeric gap. EY found that 37% of consumers would find personalized AI financial advice very or extremely helpful, but helpfulness collapses if the advice is ungrounded. Pay for the layer that fixes your actual error — missing data, missing charts, or missing synthesis — rather than buying all three at once.
Jenova’s fit is specific. It is the strongest choice in this set when the scarce skill is holding technicals, fundamentals, and macro in one argument over multiple sessions. It is the wrong exclusive choice when you need the system of record for filings, a professional execution network, or a full drawing-and-alert workstation. Used with that boundary, it is one of the few platforms that treats three-factor analysis as a single reasoning problem rather than as three products that happen to share a login.
References
- EY — Nearly half of global consumers now use AI to guide savings and investment decisions
- Statista — Artificial intelligence (AI) in finance: statistics and facts
- Bridgewise — 78% now use AI for investment information, global study finds
- Stanford HAI — Economy | The 2025 AI Index Report
- Federal Reserve — Monitoring AI Adoption in the U.S. Economy
- Koyfin — Comprehensive financial data analysis platform
- TradingView — AI Chart Copilot public beta announcement
- Fiscal.ai — AI-powered investment research and financial data infrastructure
- Bloomberg Professional — Bloomberg Terminal product overview
- Investopedia — Beginner's Guide to the Bloomberg Terminal
- Cheddar Flow — Koyfin Review: An In-Depth Analysis of Its Features & Pricing
- QuantRoutine — Koyfin Review (2026)
- Koyfin Help — Global Equities, Fundamentals & Valuation
- Bloomberg Professional — Economics data and research tools