AI REIT Investment Analyst: FFO, AFFO, NAV and Cap Rates
2026-08-28
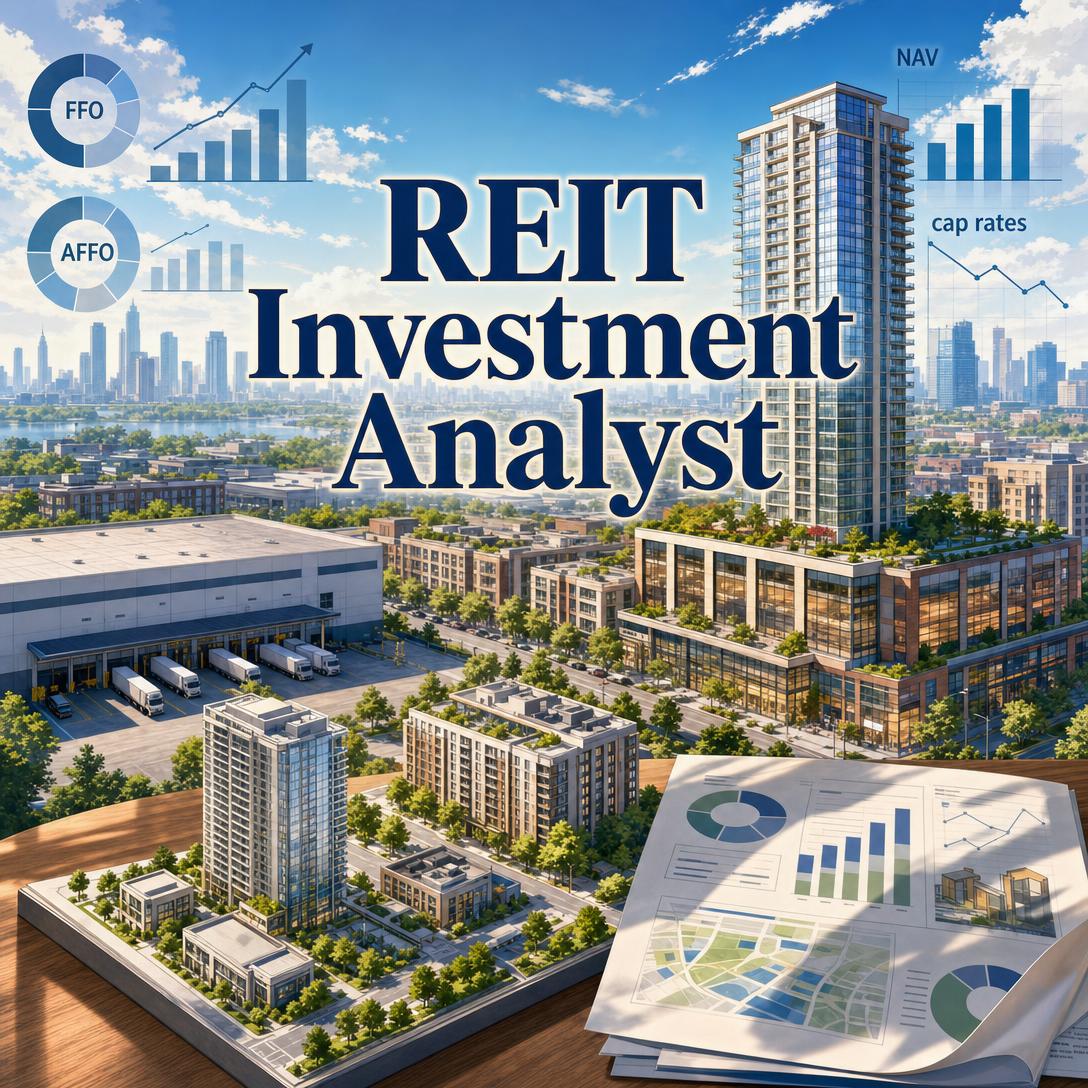
REIT Investment Analyst helps you evaluate real estate investment trusts the way institutional investors do — by FFO, AFFO, NAV, and cap rates, not by misleading GAAP earnings. While public REITs look like ordinary stocks on a brokerage screen, their economics run through property cash flow, lease structures, supply pipelines, and the spread between public pricing and private real estate values. This AI applies that framework across equity REITs, mortgage REITs, and hybrids, sector by sector.
✅ FFO and AFFO first — never EPS as the lead earnings metric ✅ NAV and implied cap rates that connect stock prices to private property values ✅ Same-store NOI, lease rollover, and supply analysis by property type ✅ Distinct mortgage-REIT framework: book value, NIM, leverage, and hedges
To understand why this matters, it helps to see how often REIT analysis goes wrong. Investors still screen these companies with P/E ratios, treat every yield as a bargain, and assume rising rates are uniformly bad. Those shortcuts distort both income decisions and valuation.
Quick Answer: What Is REIT Investment Analyst?
REIT Investment Analyst is an AI research tool that evaluates real estate investment trusts using FFO, AFFO, NAV, and cap rates to assess property-level value. It is built for investors who need sector-aware analysis rather than generic equity commentary.
Key capabilities:
- FFO quality review, AFFO payout analysis, and per-share growth after dilution
- NAV estimates, Price/NAV premiums or discounts, and implied versus transaction cap rates
- Same-store NOI decomposition, mark-to-market rent gaps, and supply-pipeline risk
- Sector-specific KPIs from industrial and apartments to data centers, net lease, and mREITs
Why Traditional REIT Analysis Breaks Down
REITs are required to distribute the bulk of taxable income, which is why many investors treat them as bond substitutes. That income focus is rational — and it is also where analysis most often fails. GAAP net income charges large non-cash depreciation against assets that often appreciate, so EPS systematically understates cash generation. Nareit developed FFO specifically to correct that distortion, and AFFO goes further by deducting recurring capital needs that actually support the dividend.
The opportunity is real. REITs delivered strong investment performance through mid-year 2026 and outperformed the broad equity market. CBRE expects U.S. commercial real estate investment activity to rise 16% in 2026, to $562 billion. But accessing that opportunity with the wrong toolkit is frustratingly difficult:
- Wrong earnings metric. Leading with EPS or P/E on a REIT is like valuing a factory by ignoring the cash it produces because the building is being depreciated.
- Yield without coverage. A 7% dividend is not income if AFFO cannot support it through a vacancy spike or a refinancing wall.
- Rate slogans instead of transmission. “Rates up, REITs down” ignores lease duration, leverage mix, and whether higher yields reflect a strong economy or a credit crunch.
- One framework for every property type. A data-center REIT’s power capacity and hyperscaler concentration are not interchangeable with a mall’s tenant sales per square foot.
5.9% — REIT implied cap rate reported on Nareit’s industry tracker
That implied yield only means something next to private-market transaction cap rates, Treasury yields, and sector supply. CBRE’s H1 2026 Cap Rate Survey found the all-property average cap rate essentially flat even as the 10-year Treasury peaked at 4.67% in mid-May. Public-private spreads move; slogans do not capture them.
New construction remains the primary fundamental risk. J.P. Morgan’s 2026 commercial real estate outlook still favors multifamily and industrial, with retail steadier and office only gradually recovering. U.S. office annual net absorption reached 8.5 million square feet by April 2026, reversing a 27.1 million square-foot decline the prior year — a reminder that even the most maligned sector is not a single trade. Trophy assets and commodity offices are living in different cycles.
This is exactly what REIT Investment Analyst was built for.
Why REIT Investment Analyst
REIT Investment Analyst treats listed real estate as real estate. The starting point is property cash flow and replacement cost, not a stock-market narrative. It leads with Nareit-defined FFO and cash-oriented AFFO, anchors valuation in NAV and cap rates, and switches frameworks the moment a ticker is a mortgage REIT rather than an owner of buildings.
| Traditional Approach | REIT Investment Analyst |
|---|---|
| P/E and EPS as the headline | FFO, AFFO, and same-store NOI as the earnings stack |
| Dividend yield as a buy signal | AFFO payout ratio, retained cash flow, and coverage stress |
| “Rates bad for REITs” | Sector, leverage, lease structure, and cap-rate spread to Treasuries |
| One KPI set for every name | Industrial mark-to-market, hotel RevPAR, tower tenancy, mREIT book value |
| Hours in 10-Ks and supplements | Prompt-driven, source-cited analysis you can interrogate |
Relative valuation is the workhorse: P/FFO as the REIT equivalent of P/E, P/AFFO when capex intensity differs across peers, Price/NAV as the public-versus-private arb, and implied cap rate versus what private buyers actually pay. Funds from operations remains the industry standard for operating performance, but not all FFO is equal. Persistent gaps between Nareit FFO and company-defined “core” or “normalized” FFO are a red flag — management may be stripping out costs that recur every year.
The analyst also insists on per-share math. REITs pay out most of their cash, then often refill the balance sheet through ATM programs and secondary offerings. Total FFO growth minus dilution is what shareholders actually keep. External growth only creates value when acquisition cap rates or development yield-on-cost exceed the weighted average cost of capital. Issuing equity below NAV can be FFO-accretive and still destroy long-term value.
Example prompts the tool is built to handle:
"Compare this industrial REIT on P/FFO, P/AFFO, Price/NAV, and implied cap rate versus same-sector peers. Decompose same-store NOI and flag ATM dilution."
"Walk through this net-lease name’s AFFO payout ratio, WALT, tenant concentration, and whether acquisition cap rates still exceed WACC."
"This ticker is an agency mortgage REIT. Ignore FFO. Analyze book value trajectory, NIM, leverage, hedge effectiveness, and whether EAD covers the dividend."
When the question is really about the rate path or the growth-versus-inflation mix rather than a single property company, Macro Strategist can frame the policy and cross-asset backdrop that feeds cap rates and funding costs. Keep that work separate from the REIT-level model so rates stay an input, not a slogan.
How It Works
Step 1: Name the REIT, sector, or comparison set Start with a ticker, a property type, or a short list of peers. The analyst identifies whether it is an equity REIT, a mortgage REIT, or a hybrid, then applies the matching KPI set immediately — occupancy and mark-to-market for industrial, RevPAR for lodging, book value and NIM for mREITs.
"Analyze PLD as an industrial REIT. I care about mark-to-market rents, development yield-on-cost, and the NAV premium."
Step 2: Ask a precise question Valuation, earnings quality, dividend sustainability, supply risk, and capital allocation are different jobs. A “is it cheap?” prompt produces P/FFO, Price/NAV, and implied cap rate versus the sector. An earnings prompt requires FFO/AFFO versus consensus, same-store NOI, occupancy, and guidance — not a GAAP beat that depreciation manufactured.
"They just reported. Compare FFO and AFFO per share to consensus, decompose same-store NOI, and tell me what guidance actually changed."
Step 3: Read the cash-flow and NAV stack The analyst walks from reported FFO to AFFO, then to payout and retained cash. For equity REITs it capitalizes segment NOI at stated cap-rate assumptions, adds non-real-estate assets, subtracts debt and preferreds, and divides by fully diluted shares including OP units. Premiums need an explanation — embedded rent gaps, development spreads, or a fortress balance sheet. Discounts need one too.
Step 4: Stress the operating story, not the slogan Same-store NOI is decomposed into occupancy, cash rent, other income, and expenses. Pricing power is more durable than occupancy recovery, which has a ceiling. Supply is tracked as deliveries versus existing stock and absorption, because construction pipelines often matter more than the latest Fed headline. Balance-sheet checks cover net debt/EBITDA, fixed-charge coverage, floating-rate exposure after hedges, and the maturity wall.
Step 5: Interrogate the conclusion Ask what would have to be true for the current Price/NAV to be justified. Change the cap-rate assumption. Separate cash re-leasing spreads from GAAP spreads inflated by straight-line rent. If management is issuing shares below NAV, say so.
Try REIT Investment Analyst free — no credit card required.
Results & Use Cases
📊 Industrial REIT: Is the NAV Premium Earned?
Scenario: You hold a logistics REIT trading at a large premium to estimated NAV. The market is clearly pricing something; you need to know whether it is mark-to-market rent, a development pipeline, or just momentum.
Traditional Approach: Pull the supplement, guess at cap rates, and compare a headline P/FFO to a handful of peers without matching asset quality or geography. That work can take an evening and still mix industrial with “real estate” more broadly.
REIT Investment Analyst: You get a sector-matched peer set, P/FFO and P/AFFO, a NAV build with explicit cap-rate assumptions, and the implied cap rate versus recent private trades. The mark-to-market gap and lease-expiration schedule show how fast in-place rents can catch market rents — the actual justification for many industrial premiums.
- Separates cash re-leasing spreads from GAAP spreads
- Treats development yield-on-cost versus market cap rates as value creation, not volume
- Flags share issuance that dilutes NAV even when FFO looks accretive
💼 Net-Lease Income: Coverage Before Yield
Scenario: A net-lease REIT yields more than the sector and has raised its dividend for years. You want income, not a yield trap.
Traditional Approach: Sort a screener by dividend yield and five-year growth. That process ignores AFFO definitions, tenant credit, rent coverage, and whether new acquisitions still clear WACC after funding costs rose.
REIT Investment Analyst: AFFO payout, WALT, top-tenant concentration, contractual escalators, and acquisition cap rates versus cost of capital sit in one pass. An 85%+ AFFO payout with thin coverage is treated as limited cushion, not a badge of shareholder friendliness.
If the same position has to sit inside a broader income book of stocks, REITs, and ETFs, Dividend Investing Advisor can pressure-test payout safety and yield-trap risk across the rest of that sleeve without forcing equity metrics onto the REIT.
- Distinguishes Nareit FFO from “core FFO” add-backs
- Reads triple-net structure, escalators, and tenant credit as the growth model
- Keeps preferred equity and OP units in leverage and share count
📱 Earnings Print on Mobile, Between Meetings
Scenario: You are away from your desk when a residential or self-storage REIT reports. The headline is an EPS miss. You have five minutes on your phone to decide whether the story is occupancy, street rates, or a one-time item.
Traditional Approach: Wait until you can rebuild a model, or react to a headline that used the wrong earnings number.
This AI analyst: On web, iOS, or Android, you paste the ticker and ask for FFO/AFFO versus consensus, sequential occupancy, same-store revenue, and guidance. For apartments that means blended lease-rate growth and concessions; for self-storage it means street rates, existing-customer increases, and new supply in core markets.
- Full feature parity on mobile — no watered-down “lite” view
- Forces FFO/AFFO estimate comparison before the narrative
- Lets you save the thread and resume the same portfolio context later
🎯 Portfolio Sleeve: How Much Real Estate, Which Sectors?
Scenario: You already own a mix of equity REITs and a listed REIT ETF. Correlation to rates has been painful, and you need to know whether you are stacked in the same supply cycle.
Traditional Approach: Treat “REITs” as one asset class and rebalance to a target weight.
The analyst: Maps each holding to sector, cycle phase, leverage, and duration of cash flows. Lodging and variable-lease residential reprice quickly; net lease and towers do not. Mortgage REITs are pulled out of the property bucket entirely and scored on book value and funding risk.
When the question shifts from a single name to weights, drift, and stress across the whole book, Portfolio Management Strategist can test how a REIT sleeve behaves inside a multi-asset allocation — without replacing property-level work with a generic 60/40 rule of thumb.
FAQ
Is REIT Investment Analyst free?
Yes. REIT Investment Analyst can be used on the free tier with core features and limited monthly usage. Paid plans increase usage headroom and add options such as custom model selection. There is no credit-card requirement to start, and the same agent is available on web, iOS, and Android with synced history.
How is this different from a generic chatbot or a stock screener?
A screener will happily rank REITs by P/E and EPS. A general chatbot will often do the same unless you already know which metrics to demand. This analyst is constrained to REIT architecture: FFO/AFFO quality, NAV, cap rates, same-store NOI, and a separate mREIT toolkit. It will correct you — without theatrics — when those equity shortcuts show up.
Can it analyze mortgage REITs as well as equity REITs?
Yes. Mortgage REITs are leveraged financial companies, not landlords. The framework switches to book value per share, economic book value after hedges, net interest margin, leverage, duration gap, repo funding risk, and earnings available for distribution. FFO and property-level NAV are not applied to mREITs.
Does REIT analysis work on mobile?
It does. Sessions run with full feature parity on iOS and Android, including speech-to-text if you want to dictate a ticker and a question between meetings. Attach a filing excerpt or earnings release when you have it; the thread persists so you can continue the same NAV or payout discussion later on desktop.
How reliable are the FFO, AFFO, and NAV figures?
FFO has a Nareit definition; AFFO does not, and Nareit is explicit that users must understand each company’s AFFO construct. NAV is an estimate whose output moves with cap-rate assumptions. The analyst states those assumptions, prefers company supplements and sector research, and frames values as implications — not as a single “true” price. Treat it as institutional-style research support, not a substitute for a licensed advisor.
Which property sectors can it cover?
Residential, office, malls, net lease, industrial, healthcare, data centers, self-storage, lodging, towers, timber, farmland, gaming, and specialty/diversified portfolios, plus agency, non-agency, and commercial mortgage REITs. Primary coverage is U.S.-listed names; international and non-listed REITs can be discussed with structure and data caveats. Sector paths still differ sharply in 2026, from logistics and data centers to a split office market.
Conclusion
REIT analysis fails when investors import ordinary-stock habits into a cash-flow vehicle built on property, leases, and payout rules. EPS hides depreciation distortions. Yield without AFFO coverage creates traps. Rate headlines skip lease structure, supply, and the cap-rate spread to Treasuries. REIT Investment Analyst puts FFO, AFFO, NAV, and cap rates back at the center, with sector-specific KPIs and a clean break for mortgage REITs.
If you need to value a logistics premium, test a net-lease dividend, or read an earnings print before the market opens, start with property fundamentals and work up to the multiple. Try REIT Investment Analyst now, and explore more at Jenova.
For Developers: REIT Investment Analyst is available programmatically via the Jenova API — integrate FFO, AFFO, NAV, and cap rate analysis into your application with a single API call. Full documentation →