AI Infographic Maker: Turn Complex Data Into Clear Visuals
2026-08-28
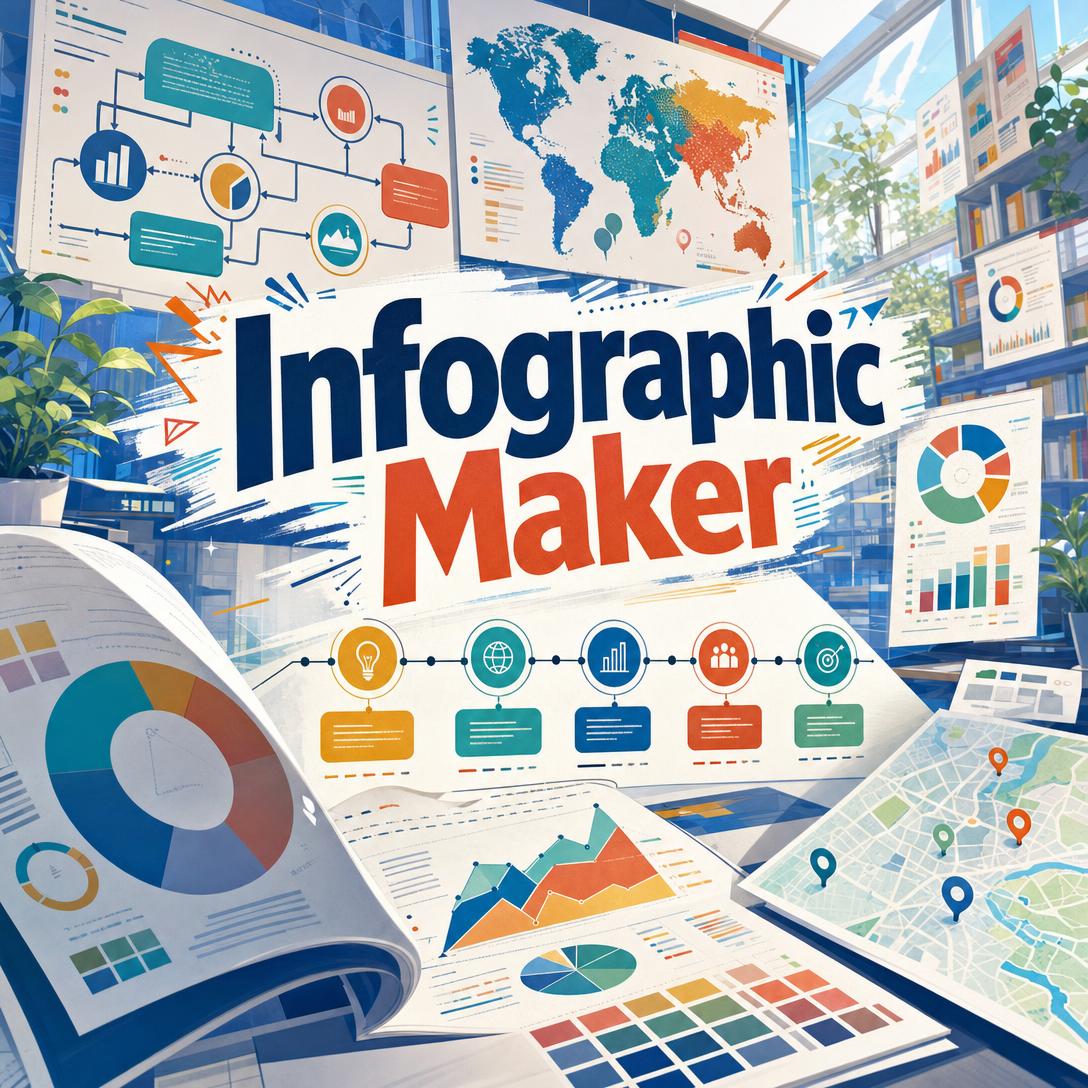
Infographic Maker helps you turn messy data, long reports, and half-formed briefs into clear, shareable infographics — with research, information hierarchy, and visual storytelling built in. While most people still dump numbers into generic templates and hope the design “reads,” this AI information designer structures the story first, then draws it.
✅ Researches credible stats when you only have a topic — then attributes sources
✅ Chooses the right chart and layout for comparison, trend, process, or geography
✅ Builds a single hero message so viewers know what to remember
✅ Adapts density and format for LinkedIn, Instagram, blogs, slides, and print
Marketers, educators, analysts, and founders all face the same brief: make complexity look simple without flattening the truth. That is harder than it sounds. To understand why so many infographics fail — and how a dedicated information designer changes the workflow — it helps to look at the creative constraints behind visual data stories.
Quick Answer: What Is Infographic Maker?
Infographic Maker is an AI information designer that turns topics, datasets, and rough notes into clear infographics with researched data, visual hierarchy, and source attribution. It treats every piece as data storytelling, not decoration.
Key capabilities:
- Topic-to-visual research when you do not already have numbers
- Layouts for statistical, process, timeline, comparison, map, and explainer infographics
- Chart selection matched to the data relationship — bars, lines, donuts, flows, ranks
- Brand-aware color, typography, and icon systems with iterative refinement
- Format presets for social feeds, stories, Pinterest, blogs, decks, and handouts
The Creative Challenges of Turning Data Into Visuals
Audiences already prefer pictures to paragraphs. 91% of consumers preferred visuals over text in 2025, as mobile feeds rewarded content that can be scanned in a single glance. Marketers felt the same pressure: 22% said expanding from text-based to visual and audio content was their most effective diversification move in 2025, and visual assets — images, video, and color — are the top elements teams test when they optimize performance.
The communication science is equally clear. Presentations with visual aids are 43% more persuasive and more memorable than those without, and experimental work on news with charts found a direct positive effect of data visualization on reader comprehension. Data visualization, as Syracuse University’s iSchool frames it, exists to make patterns easier to see — not to ornament a slide.
But producing a visual that actually teaches is frustratingly difficult:
- The story is buried in the spreadsheet. Raw exports, survey dumps, and annual reports rarely announce a hero stat. Without editorial judgment, every number competes for attention and none of them stick.
- The wrong chart hides the point. Pie charts with eight slices, unsorted bars, and truncated axes look “designed” while failing the comparison they were meant to show. Rocky Mountain College of Art + Design notes that impact comes from matching structure to the data — not from stacking more graphics.
- Templates flatten distinct stories. Default corporate-blue grids make a climate brief look like a SaaS pricing sheet. Information-design studios tracking 2025 trends now push cognitive simplicity — fewer concepts, stronger hierarchy, less chart junk — which stock templates rarely deliver.
- Accessibility is treated as optional. Harvard’s accessibility guidance flags the usual failures: low contrast, missing labels, and images with no text equivalent. WCAG 2.1 calls for at least a 3:1 contrast ratio for graphical objects, and the U.S. Web Design System advises common chart types, two or three concepts per graphic, and a message that does not require hover states to be understood.
That gap — between “we need an infographic by Friday” and a visual that is accurate, hierarchical, and readable — is exactly what this AI designer was built to close.
How to Create an Infographic With AI
You do not start in a blank artboard. You start with a topic, a dataset, or a rough outline. Infographic Maker then does the information-architecture work: find the hero, group supporting points, pick a layout, and draw a visual system that can survive a three-second scroll.
Step 1: Share the brief, the data, or just the topic
Paste figures, upload a screenshot of a table, or name a subject. If you only have a topic, the designer researches current, citable statistics, proposes a structure, and generates. If you already have numbers, it uses yours — it will not silently swap in different data.
"Infographic on why sleep debt hurts focus, for a wellness Instagram audience. Research current stats and keep it to 5 sections."
Step 2: Lock the story before the style
A strong infographic has one primary message, three to seven supporting points, and a source line. The designer applies a simple editorial test: if a data point does not answer “so what?”, it gets cut. Comparative framing (“42% — up from 12% in 2019”) beats a lonely percentage.
"Hero should be the year-over-year change, not the raw revenue. Put last year’s number as context under the big stat."
Step 3: Match type, density, and format to the channel
Statistical pieces lead with a hero number. Process pieces use numbered steps. Timelines stay chronological. Comparisons use matched criteria. Geographic stories use the map as the organizing principle. Density follows the surface: three to five points for a feed post, more only when the format is tall enough to section clearly. Default portrait is 2:3; you can switch to 4:5, 9:16, 16:9, or 1:1 as the channel requires.
"LinkedIn landscape, clean corporate, bar chart for the ranking, no pie charts. Footer: source the BLS figures."
Step 4: Generate, then iterate by layer
Feedback is cheaper when it is specific. Ask to change data, layout, mood, type, color, or icons — not all of them at once unless you mean to. Color systems stay categorical, sequential, or diverging on purpose. Icons share stroke weight. Labels sit on the data, not in a distant legend.
"Keep the five sections and the navy/teal palette. Swap the timeline for a numbered process and enlarge the hero stat."
Step 5: Export for the surface you actually publish on
Use a sparse, bold composition for Stories and short feeds; a sectioned tall portrait for blogs and Pinterest; landscape for slides and X. If the dataset is too dense for one frame, split it into a short series with a shared palette and type system rather than crowding fifteen metrics onto one image.
Try this AI infographic designer free — no credit card required.
Creative Showcase: Infographics That Actually Get Read
📊 Quarterly performance, without the 40-slide deck
Scenario: A growth lead needs one visual for the all-hands and a matching asset for the company blog. The spreadsheet has twelve metrics. Leadership will remember one.
Traditional Approach: A junior designer spends half a day in a template tool. Axes get truncated. The “hero” is whichever number fit the biggest text box. Sources never make the footer.
Infographic Maker: The designer ranks metrics, promotes the conversion lift as the hero, groups three supporting charts, and puts methodology in small type at the base. The result is a statistical infographic that can live in a slide and a blog embed without being redrawn.
- One message per frame — supporting stats stay subordinate
- Chart type follows the relationship (trend vs. rank vs. share)
- Source line included so finance and legal can stand behind it
If the same campaign also needs landing-page graphics, logos, or a broader visual system, Graphic Designer can extend the look beyond a single infographic without forcing every asset into a chart layout.
🎓 An explainer that teaches, not just decorates
Scenario: A public-health communicator has to explain how mRNA vaccines work to a general audience. The science is dense. The reading time is not.
Traditional Approach: A long illustrated article, or a research poster that specialists love and everyone else skims. W3C guidance on complex images is ignored, so the visual has no plain-language summary of what the graphic is supposed to show.
This information designer: Builds an educational infographic: concept → mechanism → what it means for the reader → takeaway. Icons stay functional. Color is sequential where magnitude matters, categorical where types differ. A short caption states the intended conclusion in text, matching USWDS advice to get to the point in language the audience already understands.
- Progressive disclosure instead of a wall of callouts
- Common chart types when the audience’s data literacy is unknown
- Caption and source line that can stand if the image is described, not only seen
When that explainer needs to travel as a conference poster or a hallway handout, Poster Maker is the natural next step — same story, print-aware hierarchy, larger type.
📱 A five-section carousel drafted between meetings
Scenario: A founder is on the train with a phone, a customer-research quote, and a launch tomorrow. They need a tall infographic for Instagram and a square cutdown for the grid.
Traditional Approach: Open a mobile template app, pick a pastel theme, and type until the text overflows. No research. No contrast check. The “data” is a slogan.
Infographic Maker, on iOS or Android: The founder pastes the quote and asks for a list infographic with five proof points, researched stats, and a 4:5 portrait. They iterate once — “warmer palette, larger numerals, drop the jargon” — and export. Full feature parity across web, iOS, and Android means the same project continues on a laptop later.
- Mobile-first density: five to eight points, not a dashboard
- Format switching without rebuilding the narrative
- Fast enough to ship before the news cycle moves
Once the visual exists, Social Media Content Generator can write the platform-native caption, hook, and alt-style copy so the infographic does not go out with a one-line “Thoughts?” underneath.
Frequently Asked Questions
Is Infographic Maker free?
Yes. You can use Infographic Maker on a free plan with core features and limited monthly usage — no credit card required. Paid tiers raise usage limits if you produce infographics in volume. Usage resets monthly on your billing date, so the full allowance is available from day one rather than dripped out as a daily cap.
How is this different from Canva or a generic AI image tool?
Template tools start with decoration and ask you to pour content in. General image models start with a picture and often scramble long labels. This product starts with information design: narrative arc, hierarchy, chart choice, density, and sources. It will research a topic when you lack data, refuse to treat every brief as “corporate blue bars,” and iterate by layer (content, layout, style, type, color, icons) instead of regenerating a new random poster each time.
Can Infographic Maker research data if I only have a topic?
Yes. Give it a subject and an audience. It searches for current, citable figures, prefers primary sources over aggregators, organizes a hero plus supporting sections, and puts attribution in the footer. If you supply your own numbers, it keeps them. It will not quietly replace your data with prettier statistics.
Does it work on mobile?
Yes. Projects run with full feature parity on web, iOS, and Android, with settings in sync across devices. That covers the train-platform scenario above: brief on a phone, refine on a desktop, publish from either. Speech-to-text is available if you would rather talk the brief than type it.
Can I match brand colors, type, and format?
Yes. Specify palette, mood, and channel, or upload a reference and ask for the same structure with your content. Format presets cover Instagram posts and Stories, Pinterest, LinkedIn, X, Facebook, slides, blogs, and print-style portraits. Tell it the aspect ratio you need; the default is a 2:3 portrait when you do not specify one.
Are the infographics accurate and accessible?
Accuracy depends on the inputs. User-supplied data is used faithfully; researched data is attributed. The designer is built to avoid misleading tricks such as truncated axes and ornamental chart junk. On accessibility, it aims for high contrast, direct labels, and a caption-ready main message — in line with WCAG contrast guidance and W3C advice to summarize complex images in text. Output is a static image, not an interactive dashboard; for screen-reader delivery you should still pair the file with a short written summary.
Turn Your Next Dataset Into a Visual Story
Most infographics fail for editorial reasons, not artistic ones. Too many messages. The wrong chart. No source. A palette that cannot be read. Demand for visual content is not slowing — nearly 75% of marketers already use AI for media creation, and about 94% plan to use AI in content creation through 2026 — but volume without hierarchy just produces more noise.
Infographic Maker is the fix for that workflow: research when you need it, structure when the data is a mess, and a visual system that can be iterated without starting over. Bring a topic, a CSV, or a half-written outline. Get back a graphic someone can understand in a few seconds — and still trust after they look closer.
Try Infographic Maker now. Explore more at Jenova.
For Developers: Infographic Maker is available programmatically via the Jenova API — integrate research-backed infographic generation into your application with a single API call. Full documentation →