How Can You Use AI to Compare Three College Offers?
2026-08-26
How Should an AI Score Fit, Net Price, Location, and Career Together?
The most reliable way to use AI after three college offers arrive is to score each school on the same five layers — program fit, scholarship quality, four-year net cost, location, and career infrastructure — instead of ranking by prestige or sticker price. A domain agent such as Jenova’s College Admissions Consultant can hold all three award letters in one thread, while College Scorecard, Road2College, and College Raptor supply the federal, crowdsourced, and letter-parsing data the model should not invent.
In 2026, families are deciding under higher cash outlays than a year earlier. Undergraduate families spent an average of $34,019 during the 2025–2026 academic year, a 10% increase from $30,837. That makes a single-number ranking especially misleading.
Key factors that separate a decision-grade AI comparison from a casual chat:
✅ Gift aid versus loans. Federal Student Aid tells families to subtract grants and scholarships from cost of attendance to get net price — never to treat a large package that is mostly loans as a “better” offer. ✅ Program-level outcomes, not campus averages. College Scorecard now reports earnings and debt by field of study, which can reverse an institution-level ranking. ✅ Aid durability. A $40,000 merit award that requires a 3.5 GPA is not equivalent to a four-year guaranteed grant. ✅ Place and pipeline. Urban internship access, rural cost of living, and career-center strength change the value of the same major. ✅ One persistent file. The comparison only works if the AI remembers all three offers, your Student Aid Index, and your constraints across sessions.
To compare these tools meaningfully, it helps to treat yield season as a structured evaluation problem rather than a gut choice among acceptance emails.
Why Does a Five-Dimension Comparison Matter More After Three Offers Arrive?
A five-dimension comparison matters after offers arrive because the decision is no longer “Can I get in?” — it is “Which acceptance is actually livable, payable, and useful for the next decade?” Application-season rankings collapse once real net prices, housing, and major-level outcomes are on the table.
Federal Student Aid advises families to compare net price, not sticker price, because a higher-priced campus can cost less after grants. Net price is the amount a student pays in a single academic year after scholarships and grants. Loans and work-study do not reduce net price; they change how the remaining bill is financed.
The price environment in 2026 rewards that discipline. College Board’s Trends in College Pricing tracks how tuition, fees, and room and board diverge by sector. Average 2025–26 public four-year in-state tuition and fees ranged from about $6,360 in Florida to about $18,090 in Vermont, so two “public” offers are not interchangeable. Tuition has more than doubled this century, with a compound annual growth rate of about 4.04%.
Career data has also become granular enough to use at yield. The Federal Reserve Bank of New York tracks employment outcomes by college major, and NACE publishes national graduate outcomes. An AI that ignores those sources will overweight brand and underweight the major you will actually complete.
What Should You Look for in an AI College-Offer Comparison Workflow?
You should look for a workflow that can ingest three award letters, separate gift aid from self-help, pull program-level earnings, and keep your priorities stable across chats. Tools that only chat, only parse letters, or only show federal averages each miss a layer.
Use this checklist before you trust any AI output with a deposit deadline:
- Offer-letter fidelity. Tuition, fees, housing, meal plan, grants, scholarships, work-study, and loans listed on separate lines.
- Net-price math that matches federal definitions, not a homemade “discount rate.”
- Renewal rules. GPA floors, credit-hour minimums, and whether merit aid is four-year or one-year.
- Program fit evidence. Curriculum, accreditation, research or clinical seats, and whether your intended major is actually available.
- Location costs. Rent, transportation, and whether internships exist in that metro — not just “urban” versus “rural” labels.
- Career infrastructure. First-destination reports, internship pipelines, alumni density in your field, and program-level Scorecard earnings.
- Memory. The model should not forget College B’s housing gap when you later ask about College C’s career center.
- Source discipline. Dollar figures should be traceable to your letter or to a named dataset, not to the model’s prior training.
Jenova’s College Admissions Consultant is strong on the fit, strategy, and persistent-memory side of that list. It is weaker as a dedicated award-letter parser: you still paste or type the numbers. College Raptor is stronger at reading letters and weaker at qualitative fit. Road2College is stronger at showing what similar students received. College Scorecard is strongest as a free outcomes baseline and does not know your personal offer at all.
How Do Jenova, College Scorecard, Road2College, and College Raptor Compare?
Jenova is strongest when you need one advisor to reason across fit, cost, location, and career in the same conversation, while College Scorecard, Road2College, and College Raptor each dominate a narrower slice of the same decision. None of the four replaces the others; the practical pattern is to let Scorecard ground outcomes, let Raptor or Road2College ground money, and let a domain agent synthesize the yield choice.
| Feature / Dimension | College Scorecard | Jenova College Admissions Consultant | Road2College Compare Offers | College Raptor |
|---|---|---|---|---|
| Program fit | Fields of study, completion, and related earnings | Profile-based comparison of major, academics, and preferences | Insights and list-building; less major-level coaching | Limited; money-first |
| Scholarship / aid comparison | Average net price, not your letter | Interprets the three offers you paste, including renewal questions | Crowdsourced peer offers plus your own package | Uploads letters and isolates grants versus loans |
| Four-year net cost | Annual net price and typical debt | Multi-year estimate from your numbers; not an official calculator | COA, grants, loans, work-study in one dashboard | Net price, out-of-pocket, estimated debt at graduation |
| Location | Setting and campus facts | Can fold setting, cost of living, and distance into the same rubric | Limited location modeling | Limited location modeling |
| Career resources | Program debt and earnings; links to career-exploration tools | Pairs with a Career Advisor for pipelines and first jobs | Sparse career-services scoring | Flags whether projected debt looks reasonable versus likely salary |
| Pricing (as of 2026) | Free | Free tier; Plus starts at $20/month | Free limited access; Essential $24.99/month or $239.88/year | Free letter comparison |
| Best for | Grounding any AI chat in federal outcomes | Students who want one persistent, multi-layer yield analysis | Families who want to see what similar applicants were offered | Fast, accurate decoding of messy award letters |
College Scorecard
College Scorecard remains the most reliable public baseline for costs, graduation rates, and post-college earnings. You can compare up to 10 colleges and inspect salaries and debt by field of study. It will not read your three offers, and earnings lag the current labor market.
Jenova College Admissions Consultant
The College Admissions Consultant can keep school selection, essay history, and yield analysis in one memory file, then score three acceptances against the priorities you name. It does not auto-ingest PDF award letters the way College Raptor does, and it has no crowdsourced offer graph. Paid plans start at $20/month for 30× free-tier usage; higher tiers scale from there.
Road2College
Road2College’s Compare College Offers tool lets families track scholarships, grants, loans, work-study, and total cost of attendance, then compare those packages with crowdsourced offers. Essential access is $24.99 per month or $239.88 per year. Crowdsourced rows are directional, not a guarantee that your SAI and test scores will produce the same merit award.
College Raptor
College Raptor’s Financial Aid Offer Comparison Tool is built to read award letters, highlight gift aid, calculate net price, and estimate debt at graduation. The debt figure assumes a four-year timeline and a stated family contribution; it is not a promise of what you will owe. The tool is free and comparatively thin on program fit and campus career services.
How Can AI Evaluate Program Fit Across Three Accepted Schools?
AI evaluates program fit well when you force it to compare the actual major, not the university brand — curriculum requirements, instructional model, accreditation, and whether the department has capacity in your concentration. Prestige is a weak proxy once all three schools have already admitted you.
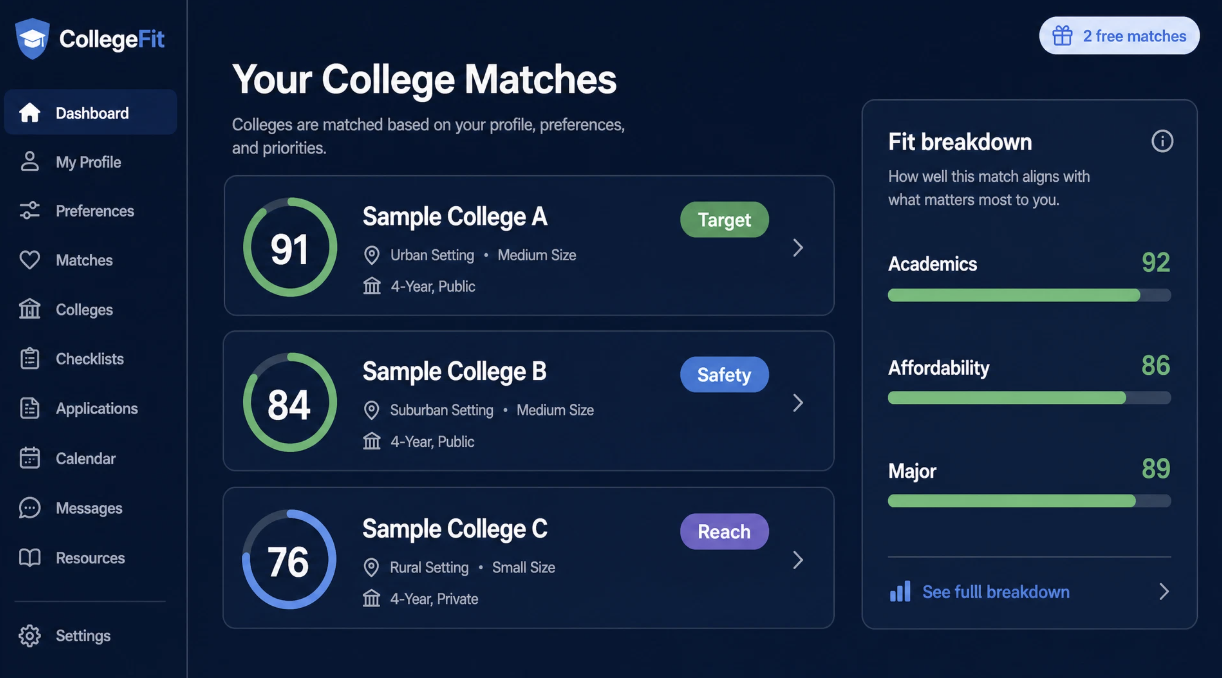
Fit dashboards typically split the question the way a yield matrix should. In the match view above, a sample urban public scores 91 as a Target, a suburban public scores 84 as a Safety, and a rural private scores 76 as a Reach, with a breakdown of Academics 92, Affordability 86, and Major 89. Those labels are useful only if you can see the inputs. An AI should reproduce that transparency in prose: which courses, which faculty ratio, which major bottlenecks.
Ask the model to build a fit card for each offer:
- Confirm the exact program name and degree (B.S. versus B.A., direct-admit nursing versus pre-nursing).
- List required sequences, studio or lab hours, and any internal GPA gates.
- Note class size and advising load if the college publishes them.
- Flag whether your intended concentration exists or is a “related” major.
- Pull Scorecard field-of-study completion and earnings for that program, not the campus median.
A prompt that keeps the agent honest looks like this:
"I was admitted to three programs: College A B.S. Computer Science (urban public), College B B.S. Computer Science (suburban public), College C B.A. Computer Science (rural private). Build a fit card for each using curriculum, accreditation, internal GPA gates, and Scorecard program earnings. Do not use overall university rank. Mark any claim you cannot source."
Jenova’s College Admissions Consultant is built for this kind of profile-to-program matching, including the earlier search that produced the three offers. General chatbots can imitate the table, but they often smear department facts across the whole university unless you pin them to a source. College Scorecard supplies the outcomes layer; it will not tell you whether the CS department is direct-admit or whether studio art requires a portfolio continuation review.
How Do You Use AI to Compare Scholarships and Four-Year Net Cost?
You compare scholarships and total cost with AI by converting each award letter into the same ledger: cost of attendance, gift aid, self-help, first-year net price, then a four-year range that applies renewal rules. If the model cannot show that arithmetic, it is summarizing marketing language, not comparing offers.
Federal Student Aid’s method is simple: find cost of attendance, then subtract grants and scholarships. Work-study and loans stay below the line. College Raptor uses the same gift-versus-loan split and adds estimated debt at graduation. Your Student Aid Index is fixed from the FAFSA; financial need still changes by school because each campus sets its own cost of attendance.
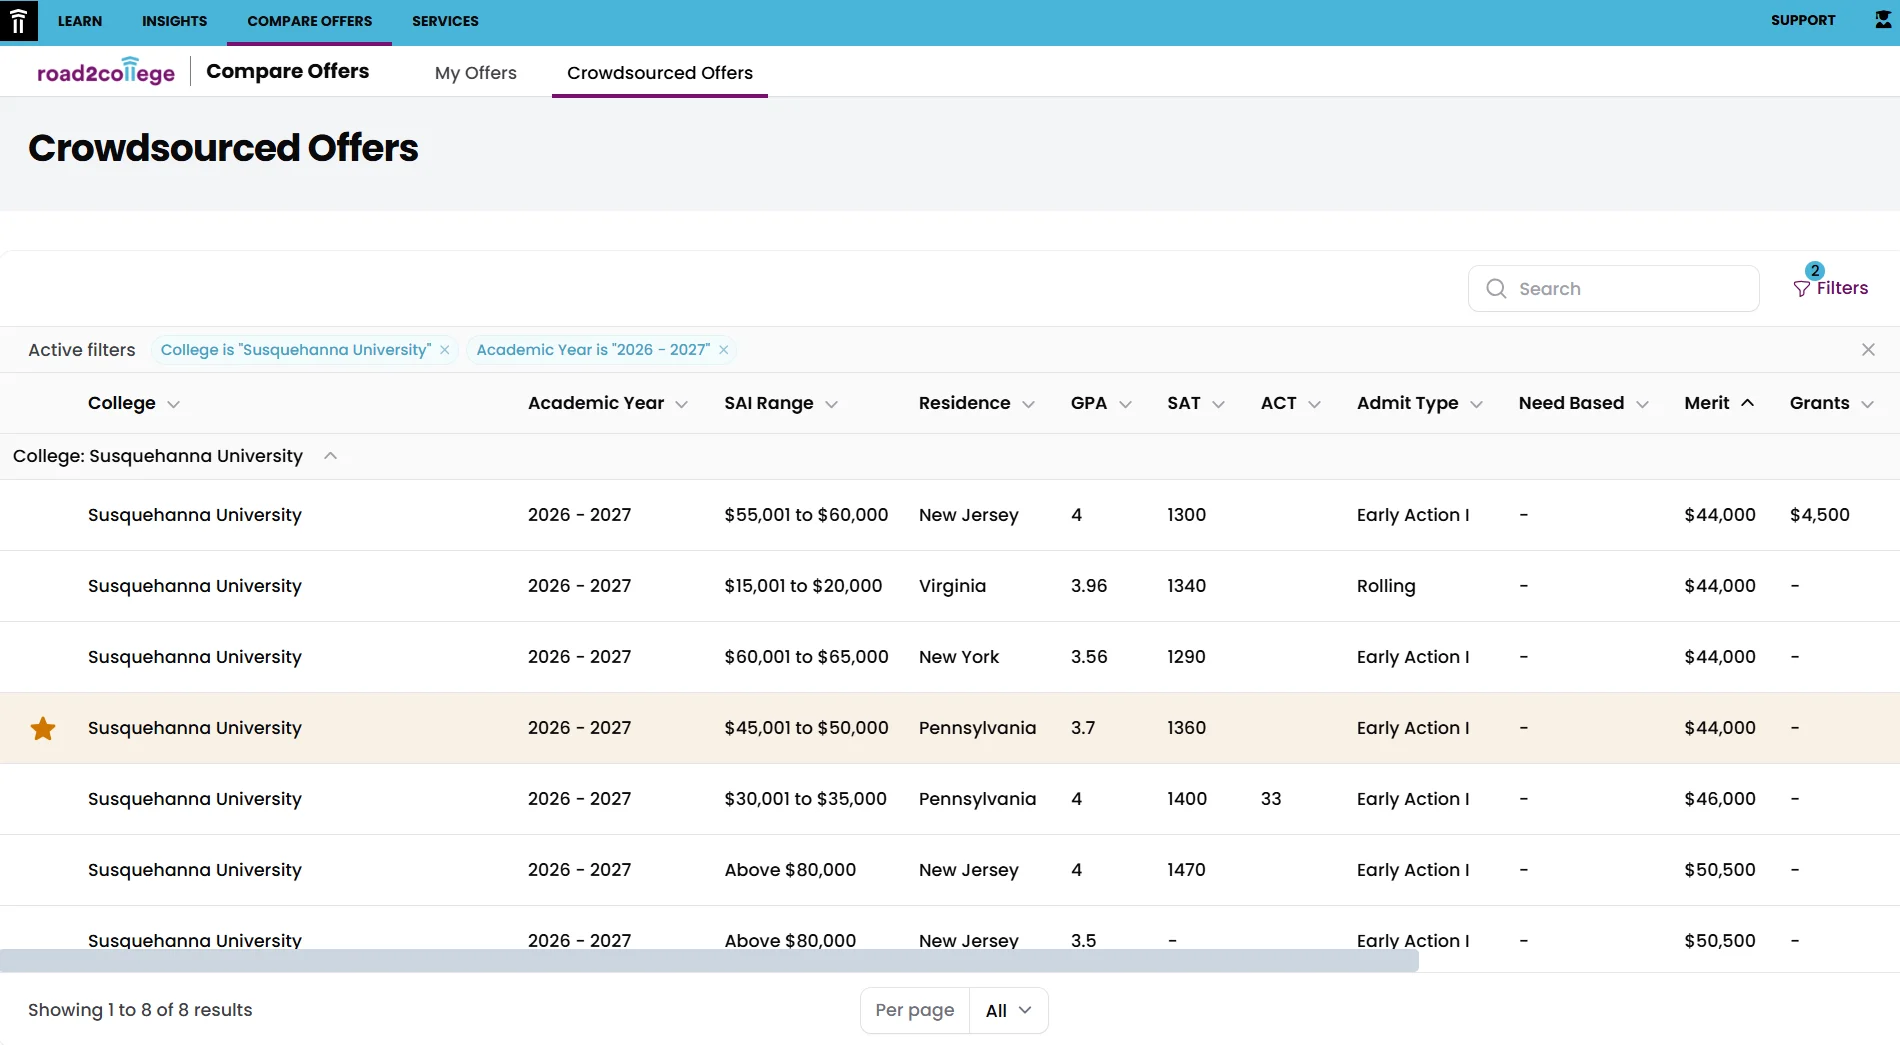
Crowdsourced tables help you test whether a merit number is typical. A Road2College-style grid for one private university can show 2026–2027 merit awards clustered around $44,000 to $50,500 across SAI bands from the mid-teens to above $80,000, with SAT scores roughly 1290–1470. That is a calibration check, not your offer.
Run the cost pass in this order:
- Type each letter into a three-column table: COA line items, gift aid, loans/work-study.
- Compute year-one net price as COA minus grants and scholarships only.
- Ask whether each scholarship is renewable and at what GPA.
- Build a four-year low/base/high: aid held constant, aid trimmed 10%, aid lost after year one.
- Add location costs the letter omitted — off-campus rent, flights home, summer storage.
- Only then compare monthly loan payments against program-level earnings.
Paste a constrained prompt:
"Here are three aid offers. For each school, output COA, gift aid, net price, loans, work-study, and a four-year total under three renewal scenarios. Cite only my numbers plus College Scorecard for typical debt. If a scholarship’s GPA rule is missing, label it Unverified."
College Raptor is the fastest way to get that ledger if your letters are PDFs. Road2College is the fastest way to see whether the merit line looks low relative to peers. Jenova is the place to stress-test renewal cliffs and to keep the cost table next to fit and career scores. A limitation across all AI tools: none of them can promise that next year’s institutional budget will honor this year’s merit grid.
How Can AI Weigh Location Against Career Resources in the Same Decision?
AI weighs location against career resources usefully when it treats place as a labor market, not a lifestyle postcard — internships, cost of living, alumni density, and the campus career office that has to convert those into jobs. A rural private with a strong industry pipeline can beat an urban campus whose career center is generic.
College Scorecard pairs institutional comparisons with career-exploration links such as CareerOneStop and the Occupational Outlook Handbook. The Census Bureau’s Post-Secondary Employment Outcomes data add state-level earnings trajectories by college and degree. NACE’s graduate outcomes series gives a national benchmark for first-destination rates. None of those datasets describe whether your career office runs on-campus recruiting in your major.
Score location and career as two columns, then look at the interaction:
- Setting. Urban, suburban, or rural — commute time to employers, not just aesthetic preference.
- Cost of living delta. A $4,000 cheaper net price can vanish in a high-rent city.
- Internship geography. Employers that recruit on campus versus a 90-minute train to the nearest market.
- Career office capacity. Counselor-to-student ratio, Handshake or equivalent, alumni platform, and major-specific staff.
- Outcomes. NY Fed major-level employment patterns plus Scorecard program earnings four years out.
- Licensure or graduate-school placement if your path is nursing, teaching, or research.
Jenova’s Career Advisor is the better specialist once the question shifts from “which college?” to “which talent pipeline?” The College Admissions Consultant should still own the combined score so location does not get decided in a separate chat that forgets the net-price table. College Scorecard will not rate career-center quality. College Raptor will estimate whether debt looks reasonable against likely salary, which is necessary but not sufficient.
A synthesis prompt:
"College A is urban public, College B suburban public, College C rural private. Using my three net prices and Scorecard program earnings for my major, score each school 1–10 on internship access, cost of living, career-office strength, and alumni density. Show the evidence. If career-office staffing is unpublished, mark Unverified rather than guessing."
How Do You Run a Complete Three-Offer Comparison in One AI Session?
You run a complete comparison in one session by loading the three letters, locking a weighting scheme, then asking for a scored matrix and a one-page recommendation that a parent could audit. Switching tools midstream is fine; switching criteria midstream is how families talk themselves into the brand they already wanted.
For Jenova’s College Admissions Consultant, a working sequence takes about 20 minutes of setup:
- Open the agent at jenova.ai/a/college-admissions-consultant and paste all three offer letters in full.
- State constraints in one block:
"SAI is 22,000. I need to stay under $18,000 net per year. Intended major is biology, pre-health. I prefer a campus within a four-hour drive. Weight the five layers as: net cost 30%, program fit 25%, career resources 20%, scholarships durability 15%, location 10%."
- Demand the FIT-LC matrix (Fit, Investment, Territory, Labor-market, Continuity of aid) with sources on every cell.
- Ask for the weakest evidence in the winning school’s case, not only the strengths.
- If a package looks negotiable, move the appeal draft to a Negotiation Coach rather than mixing appeal tactics into the comparison.
For College Scorecard, do this in parallel:
- Search each of the three colleges and open the same field of study.
- Record annual net price, completion, median debt, and earnings.
- Feed those five numbers back to the AI so it cannot hallucinate outcomes.
For College Raptor, upload the PDFs, export net price and estimated debt, and treat that export as the cost sheet of record. For Road2College, filter crowdsourced offers by college, year, and SAI band to see whether your merit line is an outlier.
Jenova’s free tier covers limited usage of that workflow; Plus at $20/month raises the allowance to 30×. Road2College’s unlimited comparison reports sit on paid plans. College Scorecard and College Raptor remain free. The limitation to accept in every stack: if a college’s career report or scholarship handbook is not public, the honest cell is “Unverified,” not a confident 9 out of 10.
What Do College Planning Experts Say About AI-Assisted Yield Decisions?
College planning practitioners treating AI as a yield tool in 2026 tend to agree on two points: net price still beats rank, and models that cannot show their sources should not drive a deposit. The useful role of AI is to keep five incommensurable layers in one rubric so families stop deciding on whichever PDF they opened last.
"The failure mode we see is not that students ignore cost. It is that they compare year-one discounts and call the job done. A $48,000 merit award that is one-year only can be more expensive by April of sophomore year than a $28,000 four-year grant. Any AI workflow that does not force a renewal scenario is doing spreadsheet theater."
"Program-level Scorecard earnings should be a veto check, not a vanity metric. If two biology offers differ by $8,000 a year in net price but the lower-cost program’s graduates earn substantially less and borrow more, the cheap offer is not cheap. We want the model to surface that collision in one table, with the federal numbers cited, rather than narrating campus vibe."
"Crowdsourced offer graphs are excellent for detecting a lowball, terrible as a substitute for your letter. Use them to decide whether an appeal is warranted, then negotiate from your file, not from a stranger’s SAT score. The families who get value from AI are the ones who paste every line of COA and ask for Unverified labels. The families who get hurt ask ‘which school is best’ and accept a fluent paragraph."
— Jenova Product Team, AI-assisted college planning (product and workflow design for admissions yield tools)
References
- Sallie Mae — How America Pays for College 2026
- Federal Student Aid — Comparing School Financial Aid Offers
- Institute for Higher Education Policy — Updated College Scorecard Data
- College Scorecard — U.S. Department of Education
- Federal Student Aid — How To Evaluate Your Aid Offers
- College Affordability and Transparency Center — Net Price Calculator Center
- College Board Research — Trends in College Pricing
- College Board Research — Trends in College Pricing Highlights
- Education Data Initiative — Average Cost of College
- Federal Reserve Bank of New York — The Labor Market for Recent College Graduates
- NACE — Graduate Outcomes
- Road2College — Compare College Offers
- College Raptor — Compare Financial Aid Offer Letters
- U.S. Census Bureau — Post-Secondary Employment Outcomes