How Can AI Weigh Conflicting Earnings, News, and Price Signals?
2026-08-23
What Separates Multi-Signal Weighing From Binary Stock Prediction?
The more useful AI stock tools in 2026 do not answer “will this ticker go up?” They decompose a conflict — a beat that sells off, a panic headline that the tape ignores, a cheap multiple sitting under a broken chart — and assign weight to each channel before any action is even considered. Jenova’s Fundamental Stock Analyst and Technical Stock Analyst are built for that decomposition. Score-first platforms such as Danelfin and research terminals such as Fiscal.ai are stronger when you want a compressed rating or a sourced filing lookup.
What actually separates signal-weighing from binary prediction:
✅ Independence of channels — earnings quality, news tone, and price structure are scored separately before they are combined ✅ Regime filters — the same headline does not get the same weight in a momentum-up market as in a drawdown ✅ Contradiction diagnostics — disagreement is treated as information, not as noise to be averaged away ✅ Action without a direction call — wait, size down, hedge, or re-underwrite, rather than force a buy or sell ✅ Traceable reasoning — a reader can see which channel dominated and why
Binary models feel decisive because they hide the trade-off. Multi-signal systems feel slower because they surface it. The rest of this guide is a working method for choosing and using the second kind.
Why Do Earnings, Headlines, and Price Action So Often Disagree?
They disagree because they measure different clocks, different audiences, and different claims about the same company. Earnings describe what already happened against a consensus that was set weeks earlier. News describes what people are saying in the next hour. Price describes what capital is willing to pay right now, including flows that have nothing to do with the story.
A beat can sell off when the beat was rented from a lower tax rate, a one-time gain, or guidance that quietly rolled over. A brutal headline can print while the stock holds its range because the information was already in the options surface. A chart can look broken while free cash flow is accelerating because the holders who are selling are not the holders who will set the next multiple.
Federal Reserve research on the S&P 500 found that sentiment and momentum, taken one at a time, do not reliably forecast the next month’s return. A multiplicative combination of the two does — and the effect is concentrated in periods when sentiment has been falling and recent momentum is already negative. That is a precise illustration of the larger point: isolated signals mislead; interactions carry the information.
Charles Schwab has described how sentiment cycles can move prices independently of the underlying news flow. Investopedia’s definition of market sentiment is useful here: bullish or bearish tone is a description of crowd posture, not a substitute for cash-flow analysis. When the three channels disagree, the disagreement is usually the thesis.
What Should You Look for in an AI That Reconciles Conflicting Market Signals?
You should look for a system that keeps channels separable, states a weighting rule, and can recommend inaction. An AI that always emits a direction has already failed the job, because many honest conflicts resolve to “do not size this yet.”
The evaluation frame used in this article is the Earnings–Narrative–Tape (ENT) model. Each incoming fact is tagged to one channel, scored for quality, then combined only after a regime check.
Earnings channel. Did results beat, and was the beat durable? Look for revenue quality, margin mix, cash conversion, and whether guidance rose for the same reasons the print did. An AI that cannot distinguish a clean beat from an accounting beat will overweight the headline number.
Narrative channel. Who is speaking, to whom, and how new is the information? A Form 8-K, an earnings-call hedge, a supplier comment, and a viral post are not equal. RavenPack’s work on news sentiment shows that stocks with negative sentiment momentum tend to keep underperforming, while positive sentiment momentum tends to persist — but only if you are measuring momentum of tone, not a single article.
Tape channel. Is price confirming, ignoring, or leading the other two? Volume, range, failed breakouts, and where the stock sits versus its own moving structure matter more than a one-day percent change.
Four practical tests for any tool:
- Can it refuse a verdict? If every query returns Buy or Sell, the model is collapsing ENT into a coin flip.
- Can it show the loser channel? A useful answer names which signal is being overruled and at what cost.
- Does the weight change by regime? CNN’s Fear & Greed Index treats fading momentum as fear and rising momentum as greed. An AI that uses the same news weight in both states is not weighing; it is averaging.
- Is the output a decision object or a slogan? Position size, invalidation level, and time horizon are decision objects. “Bullish” is a slogan.
FINRA’s review of AI in the securities industry notes that models can break when markets enter conditions absent from training data — sharp volatility, disasters, geopolitics. A signal-weighing tool should degrade into uncertainty, not into a more confident score.
How Do Jenova's Stock Analysts Compare to Seeking Alpha, Danelfin, and Fiscal.ai?
Jenova’s pair of specialized agents is strongest when you need a written reconciliation of conflicting channels. Seeking Alpha is strongest when you want factor grades plus a large editorial library. Danelfin is strongest when you want a single, attributed probability of beating the index. Fiscal.ai is strongest when you want filing-fresh, auditable financial data rather than a thesis.
A 2026 roundup of AI stock tools found that roughly 30% of U.S. retail investors now use AI in investment decisions, and that the useful split is no longer “AI versus spreadsheets.” It is score-first products versus research-first products. The table below uses that split.
| Feature / Dimension | Jenova stock analysts | Seeking Alpha | Danelfin | Fiscal.ai |
|---|---|---|---|---|
| How conflict is handled | Separate fundamental and technical agents; user can force an explicit weigh-in | Quant grades across Value, Growth, Profitability, Momentum, EPS Revisions, plus AI Virtual Analyst Reports | One AI Score (1–10) built from 10,000+ daily features, with factor attribution | Conversational Q&A over structured fundamentals and filings |
| Earnings depth | SEC filings, estimates, business-model and earnings-quality writeups | Strong on fundamentals and estimate revisions | About 150 fundamental inputs inside the score | Filing ingestion and verification within minutes of release |
| News / sentiment | Real-time search and sentiment folded into the writeup | Editorial plus quant sentiment/momentum factors | About 150 sentiment inputs | Unstructured IR and filing content; not a news-sentiment terminal |
| Price / tape | Dedicated technical agent on structure, volume, momentum | Momentum factor inside Quant Ratings | About 600 technical inputs | Not the product’s center of gravity |
| Published score track record | Not published as a composite backtest | “Strong Buy” names reported at about +23.9% annualized versus ~+11% for the S&P 500 | “Best Stocks” sleeve reported at +376% from 2017 through mid-2025 versus ~166% for the S&P 500 | Data platform, not a scoring product |
| Pricing (as of 2026) | Free tier; Plus $20/month | Premium about $239/year | Free tier; paid plans about $23/month | Terminal / API / MCP; retail list price not published in sources reviewed |
| Honest limitation | No single published alpha score; quality depends on how the user frames the conflict | Crowd research varies; AI reports sit on top of a ratings engine rather than replacing judgment | A 1–10 score still invites binary use even when attribution is available | Exceptional data freshness, thinner on tape-versus-narrative synthesis |
| Best for | Investors who want a reasoned weigh-in across earnings, news, and price | Long-horizon fundamental investors who like grades plus narrative research | Investors who want a transparent composite probability | Teams that need auditable, minutes-after-print financials |
Tickeron sits in a different lane: forecasts, pattern detection, and multi-agent signal stacks aimed at swing timing. Screener AI is narrower still — a filings-and-calls assistant with direct document access, useful for the earnings channel and weak on tape. AlphaSense remains the institutional qualitative search layer, typically priced beyond retail.
Jenova’s limitation is the inverse of Danelfin’s strength. There is no public, rules-based sleeve that says “these outputs returned X percent.” The gain is that a conflict can stay a conflict. You can finish a session with “earnings quality is fine, narrative is noisy, tape is not confirming — stand aside,” which a 78-out-of-100 dashboard is designed not to say.
How Does AI Combine Fundamental Value With Technical Timing?
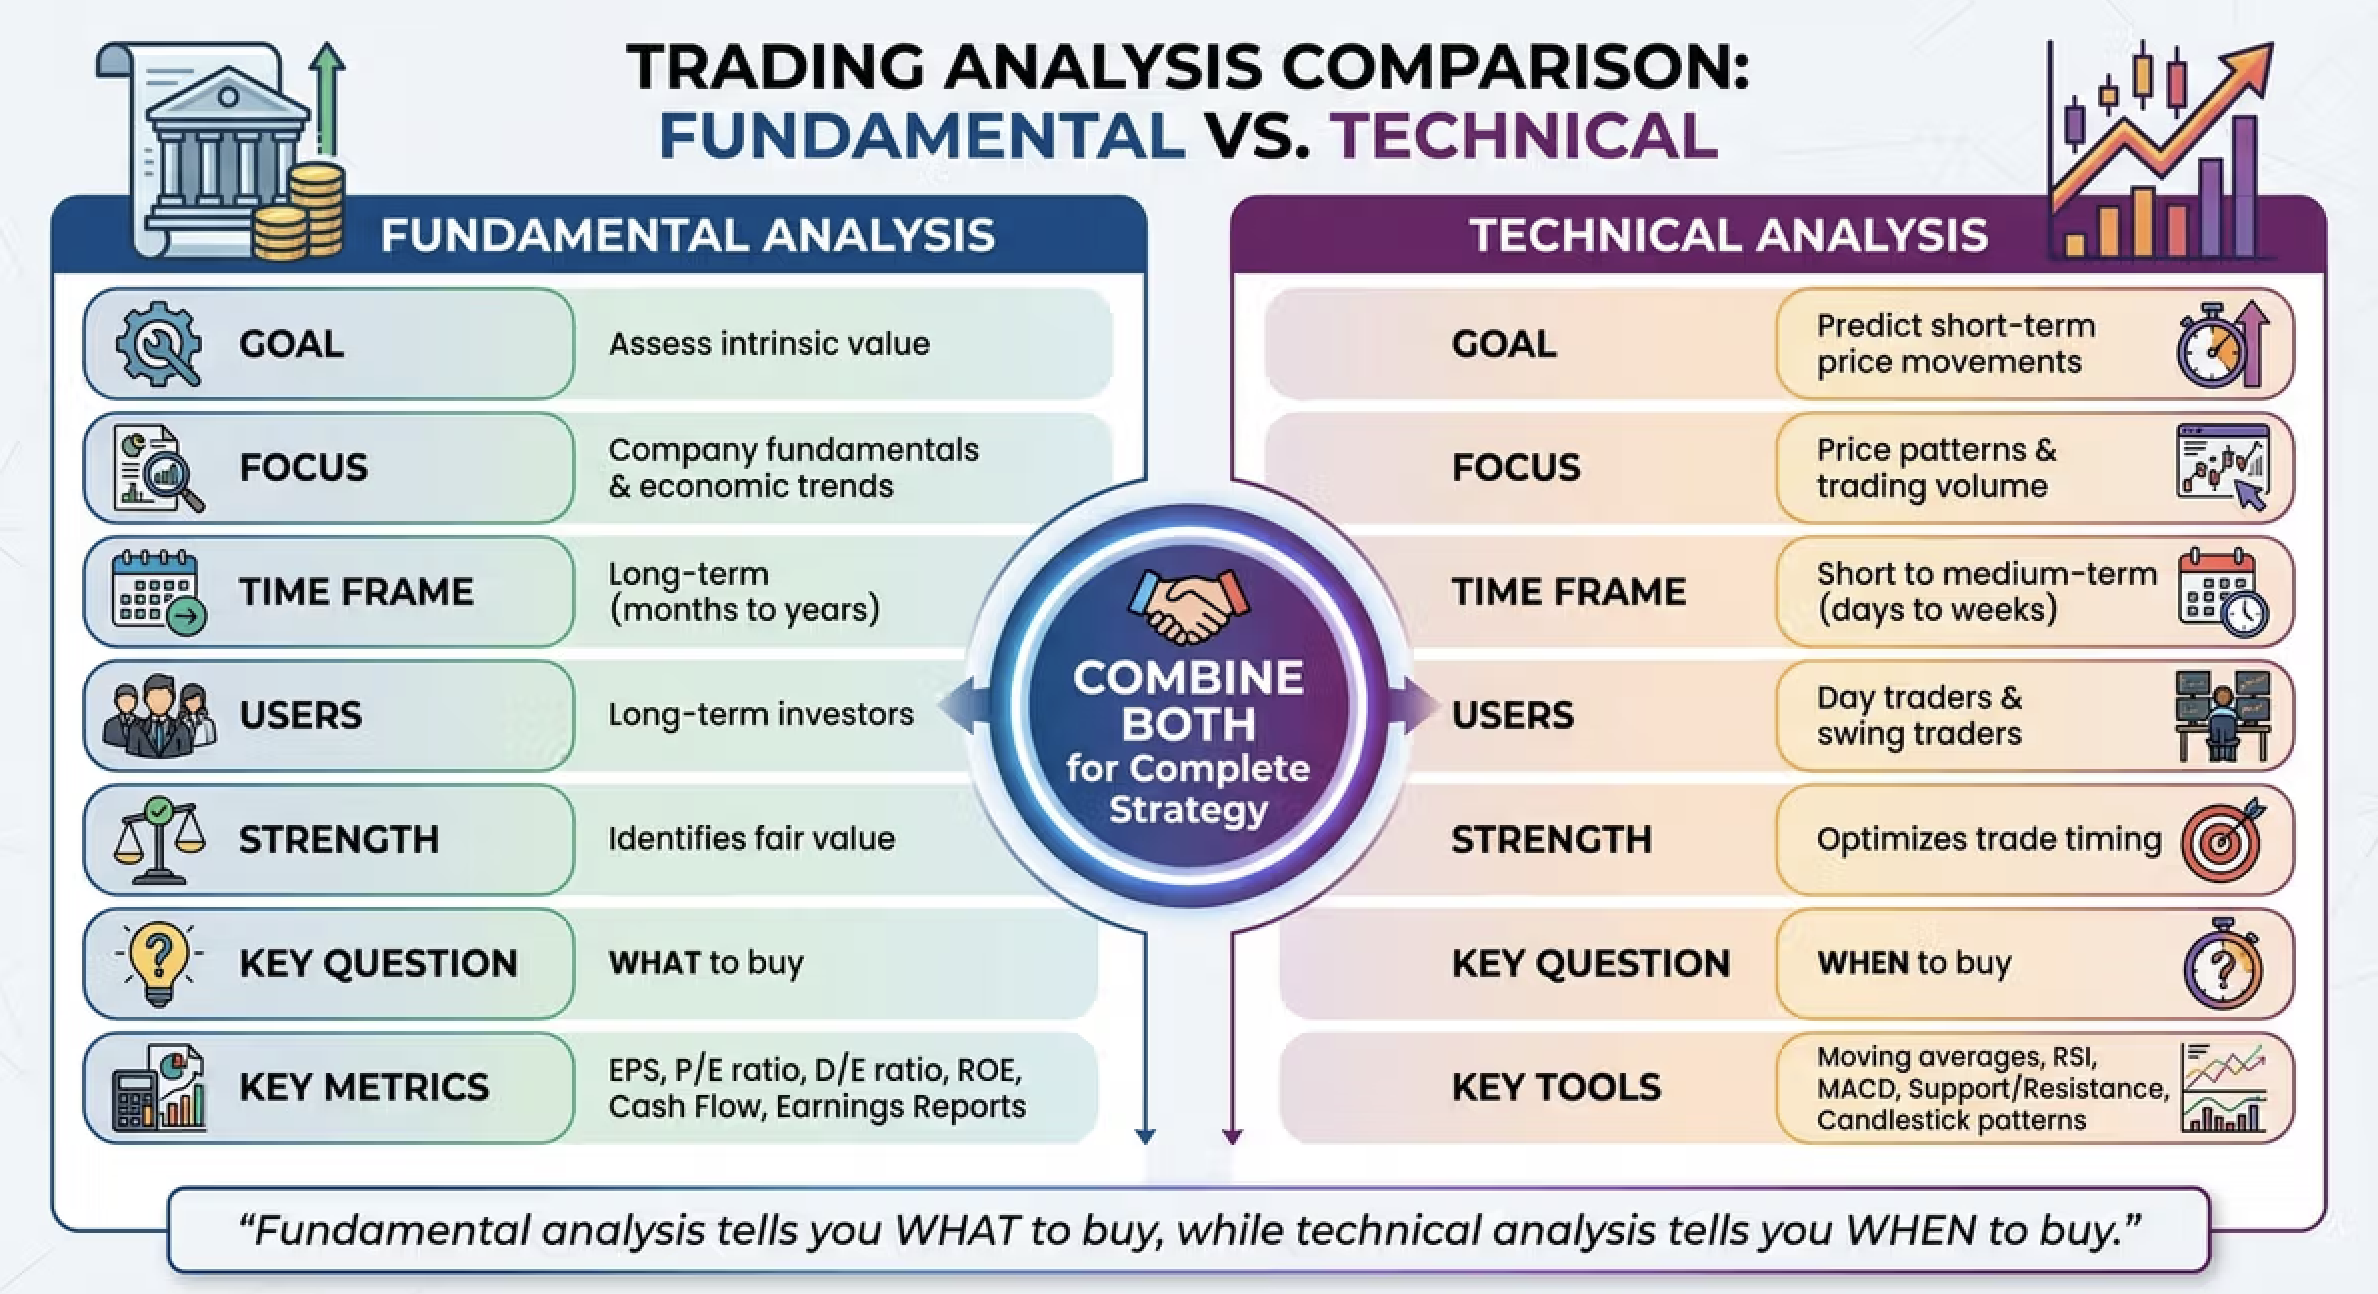
It combines them by letting fundamentals answer what is mispriced and letting the tape answer whether anyone is paying for that mispricing yet. The failure mode is mixing the clocks: using a three-year cash-flow story to justify a three-day breakout, or using a weekly moving-average cross to veto a balance-sheet that has already changed.
Jenova’s design matches that split. The Fundamental Stock Analyst works from filings, estimates, relative valuation, and business-model durability. The Technical Stock Analyst works from price, volume, and market structure, looking for defined-risk setups rather than stories. Used in sequence, they implement the old desk rule that fundamental work selects the name and technical work selects the moment — without pretending either channel can do the other’s job.
A clean combination protocol:
- Freeze the fundamental claim in one sentence, including the metric that would falsify it.
- Ask whether the last print and the last 8-K still support that sentence.
- Only then map the tape: trend, failed breakdowns, volume on the news, distance from a level that would force systematic selling.
- If the claim is intact and the tape is hostile, the output is “valid thesis, poor expression,” not “sell the company.”
- If the tape is friendly and the claim is broken, the output is “flow, not value.”
Score-first tools can approximate this if they expose components. Danelfin publishes which of its technical, fundamental, and sentiment families moved the score. Seeking Alpha’s component grades let you see Momentum rising while Value stays poor. The residual risk is interface design: a single number still trains users to ignore the components.
FINRA has separately warned that social-sentiment gadgets are a weak basis for a trade on their own. Tape confirmation is not the same thing as Twitter confirmation. Volume at a level is a positioning fact. A trending hashtag is a narrative fact. ENT keeps them in different columns.
How Should News Sentiment Be Weighted When It Conflicts With Earnings Quality?
News should be weighted by novelty, source proximity, and whether the tape already paid for it — not by emotional temperature. A loud story about a fact that was in the 10-Q two weeks ago is not new information. A quiet supplier comment that changes unit economics is.
Start with a simple hierarchy:
- Primary documents (10-K, 10-Q, 8-K, audited statements) outrank
- Management language on the call, which outranks
- Sell-side and press interpretation, which outranks
- Aggregated social tone
The San Francisco Fed’s sentiment-momentum result is the regime overlay. When twelve-month sentiment is already rolling over and recent returns are negative, incremental bad news has more follow-through because attention itself is rising — the same paper notes that Google searches for “stock market” spike in those windows. In that regime, narrative gets a higher weight as a flow variable, not as a truth variable. The earnings channel is not discarded; the expected path of the multiple is marked down.
The opposite error is just as common. High-quality earnings in a fearful tape get treated as damaged goods because the headline cluster is red. Schwab’s work on sentiment cycles is a reminder that crowd posture can detach from the operating story for long enough to matter. An AI that cannot say “operations improved, multiple compressed because the index is in a fear regime” will tell you to sell your winners for atmospheric reasons.
Practical weighting rules that travel across tools:
- If the news does not change next-twelve-months cash flow or the discount rate, cap its weight.
- If the news is new but the tape does not move on above-average volume, treat it as unconfirmed.
- If earnings quality is deteriorating and the tape is still bid, treat strength as a distribution window, not as vindication.
- Never let a sentiment index veto a documented change in the share count, the covenant package, or customer concentration.
The SEC has also warned investors about AI-enabled fraud and about overstated AI claims in investment products. A sentiment meter with no document trail is closer to that risk surface than a filing-backed earnings review.
How Do You Run a Multi-Signal Analysis Instead of Asking AI Whether a Stock Will Rise?
You run it by feeding the conflict, not the ticker. “What do you think of NVDA?” invites a direction. “Q2 revenue beat by 4%, guidance was in-line, the stock is −9% on 2× average volume, and two customers were just named in export headlines — weigh the channels” invites a decision object.
On Jenova, a complete pass takes a few minutes and two agents.
- Open the Fundamental Stock Analyst and state the conflict in one block:
“Ticker X beat EPS by 8% but missed revenue. Gross margin fell 90 basis points. Guidance for next quarter is flat. Two sell-side notes call the beat ‘low quality.’ The stock is down 6% after hours. Separate earnings quality from the headline beat, then tell me what would have to be true for the multiple to expand from here.”
- Force the ENT labels in a follow-up:
“Score the earnings channel and the narrative channel separately, 1–5, and list the single fact that would flip each score.”
- Bring in the Technical Stock Analyst on the same thread or via mention, and keep the fundamental claim frozen:
“Ignore valuation. On the daily and weekly, is this after-hours gap a break of structure or a flush inside a range? Where is invalidation if I am expressing a long? Where is invalidation if I am fading the bounce?”
- Ask for a non-directional output:
“Do not give me buy or sell. Give me: stand aside / express small / express full, plus the invalidation print and the date when the next hard data arrives.”
If macro is the hidden fourth channel, Economics Analyst can test whether the tape move is company-specific or a rates-and-dollar impulse. That stops you from blaming a CFO for a factor rotation.
On Danelfin, the equivalent discipline is to open the attribution panel before the score. If the 8/10 is almost entirely technicals while fundamentals are flat and sentiment just flipped, you are looking at tape, not at a full ENT agreement. On Seeking Alpha, read the Momentum and EPS Revisions grades against Value and Profitability; a strong Momentum grade on a deteriorating Profitability grade is a conflict, not a “Strong Buy” to be obeyed. On Fiscal.ai, ask the filing a narrow question — cash conversion, deferred revenue, buyback authorization — and refuse to let the chat wander into a price target.
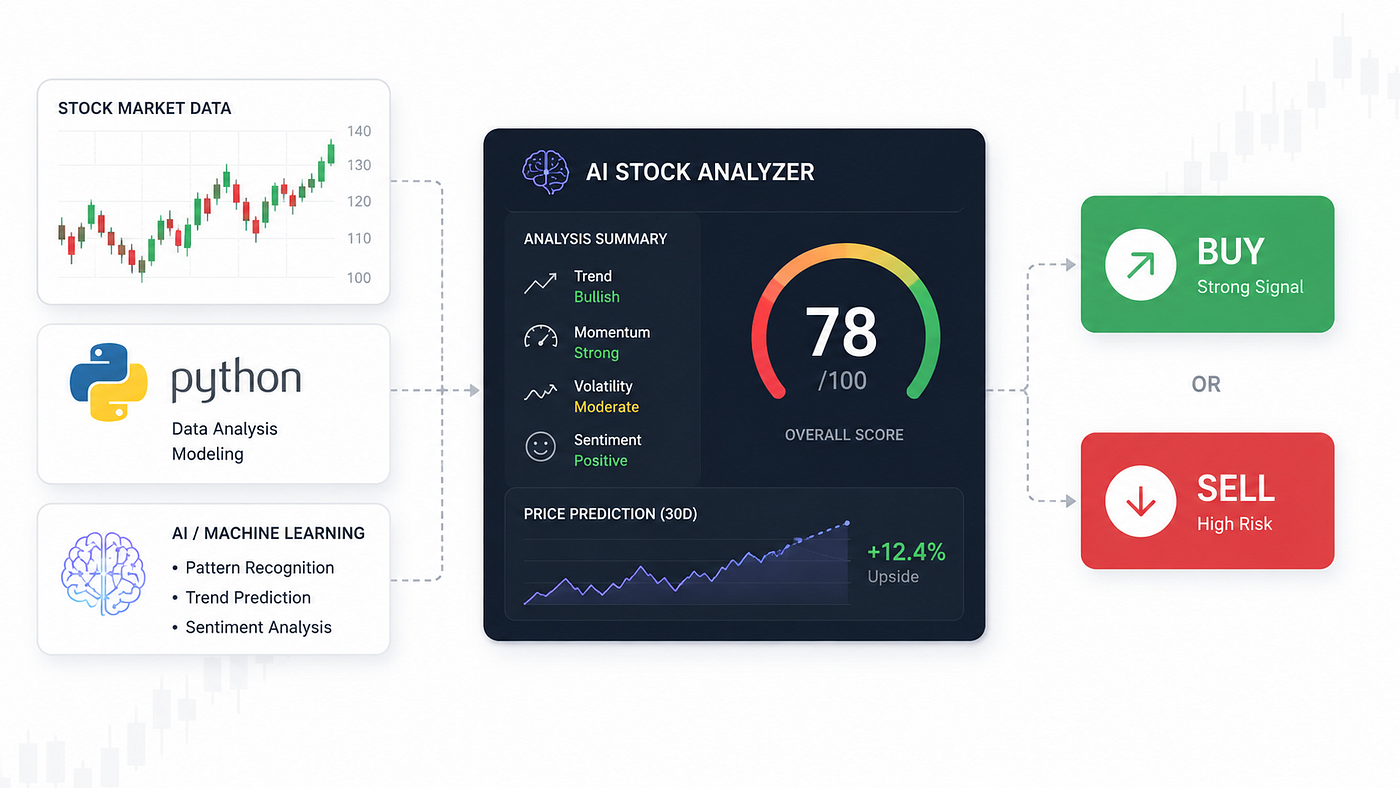
Dashboards that collapse ENT into one gauge and then into a green Buy are doing the opposite of this workflow. The 78/100 and the +12.4% thirty-day arrow are not a weigh-in. They are a prediction costume. Use them, if at all, as one more input in the tape column — never as the meeting minutes.
What Do Research Teams Say About AI That Synthesizes Conflicting Market Data?
Research teams keep landing on the same uncomfortable result: single-factor stories do not forecast well, interaction terms do, and unaudited AI claims are now a compliance problem as much as a modeling problem.
“The recurring error we see is asking a model for a direction when the data is actually a disagreement. Earnings, news, and price are not three estimates of the same hidden variable. They are three clocks. When you multiply a falling sentiment impulse by already-negative momentum, you get a flow forecast. When you average them with a clean cash-flow beat, you get mush. The Fed’s sentiment-momentum work is the cleanest public example of why the product operator has to keep the channels from collapsing too early.”
“A second error is treating a composite score as if it were a research memo. Attribution panels help, but the interface still trains people to obey the integer. We would rather ship an answer that says ‘earnings 4, narrative 2, tape 1 — stand aside until the next 8-K’ than a 78 that looks like conviction. The integer is easier to market. The stand-aside is easier to survive.”
“None of this is a license to outsource the decision. FINRA’s point about models failing outside their training regime is the production constraint. Unusual volatility, a geopolitical gap, a new accounting rule — those are moments to widen uncertainty, not to crank the score. If your AI cannot say ‘I do not know which channel wins from here,’ it is not weighing signals. It is completing a sentence.”
— Jenova Product Team, equity-agent design, eight years building research workflows on multi-model agent infrastructure
That stance lines up with SEC commentary in 2026 on liability fears slowing serious AI adoption in investment management, and with the Commission’s investor alert on AI-washing and AI-enabled fraud. A tool that narrates its uncertainty is easier to supervise than a tool that performs omniscience.
When Is the Conflict Itself More Useful Than Any Single Verdict?
The conflict is more useful whenever the channels disagree on cause, not merely on sign. A stock that is down on a clean beat is telling you the market’s model of the future changed. A stock that is up on a dirty beat is telling you that positioning, not operations, is in charge. Those are tradable facts. A forced “slightly bullish” is not.
Four recurring conflict types, and what they usually mean:
- Good earnings, bad tape. Expectation reset or factor outflows. Re-underwrite the multiple; do not automatically fade the print.
- Bad earnings, good tape. Short covering, index flows, or a known miss. Demand a second hard data point before treating strength as rehabilitation.
- Hot narrative, unchanged filings. Attention trade. Size as if you are renting volatility, not owning cash flows.
- Cold narrative, rising cash conversion. Unfashionable quality. The work is patience and an invalidation price, not a press-release rebuttal.
The Stanford result cited in 2026 tool reviews — AI analysts beating 93% of mutual-fund managers over a long window — is often used to argue for more automation. Read the other way, it is an argument for better features: machines that keep more variables in play than a human can hold. That advantage disappears the moment the interface throws the variables away and prints Buy.
Jenova’s honest gap remains the missing public scorecard. Danelfin and Seeking Alpha give you a historical integer to argue with. Fiscal.ai gives you a timestamped filing pipeline. Tickeron gives you pattern alerts. If you need a backtested sleeve, those products fit better. If you need a written weigh-in that can end in “do nothing until the channels agree,” a pair of specialized agents is the more coherent instrument.
The operational rule is simple enough to reuse on any platform. Name the three channels. Score them apart. Apply a regime filter. Let disagreement survive into the output. Direction is a luxury the data has to earn.
References
- Federal Reserve Bank of San Francisco — Using Sentiment and Momentum to Predict Stock Returns
- Charles Schwab — Why Investor Sentiment Matters
- Investopedia — Market Sentiment
- RavenPack — Stock Market Reaction to News Sentiment
- CNN — Fear & Greed Index
- FINRA — AI Applications in the Securities Industry
- Prospero.ai — The 10 Best AI Stock Analysis Tools in 2026
- Danelfin — AI Stock Analytics Platform
- Fiscal.ai — Financial Data Infrastructure and Research Terminal
- Tickeron — AI Stock Forecasts and Pattern Tools
- Screener AI — Filings and Earnings-Call Assistant
- AlphaSense — Stock and Investment Research Tools for 2026
- Investor.gov / SEC — Artificial Intelligence and Investment Fraud: Investor Alert
- SEC — Artificial Intelligence and the Future of Investment Management (Commissioner Daly, February 2026)