How Can AI Separate Technical Signals, Facts, and Forecasts?
2026-08-23
What Three Evidence Layers Should Every AI Investment Analysis Keep Separate?
The most reliable way to keep AI from mixing charts, filings, and guesses is to force every answer into three labeled layers: technical signals, fundamental facts, and future assumptions. In 2026, that separation works better when each layer is produced by a specialized tool — such as Jenova’s Fundamental Stock Analyst and Technical Stock Analyst — rather than by one blended chatbot that writes a price target in the same tone as last quarter’s cash flow.
A practical Signal–Fact–Assumption (SFA) split looks like this:
✅ Technical signals — price, volume, momentum, and market structure. These describe what the market is doing, not what a company is worth.
✅ Fundamental facts — filings, financial statements, known economic releases, and other checkable records. These describe what can be verified today.
✅ Future assumptions — growth rates, scenarios, implied multiples, and policy paths. These describe what might happen and must stay labeled as uncertain.
✅ Source and time stamps — every claim should name its evidence and whether it is historical, current, or projected.
To compare tools honestly, the test is not who writes the smoothest memo. It is who keeps these three layers from collapsing into one confident paragraph.
Why Do General-Purpose AI Tools Blend Charts, Filings, and Forecasts Together?
General-purpose chatbots blend these layers because they are trained to produce a fluent answer, not a research audit trail. The UK Financial Conduct Authority notes that tools such as ChatGPT and Gemini are not set up for investment research, are not regulated as financial advice, and can present incorrect statements with high confidence.
That fluency is the failure mode. A model asked to “analyze NVDA” will often place a moving-average crossover, a revenue figure, and a 12-month target in the same register. The reader cannot see which sentence is a chart observation, which is a filing fact, and which is a guess.
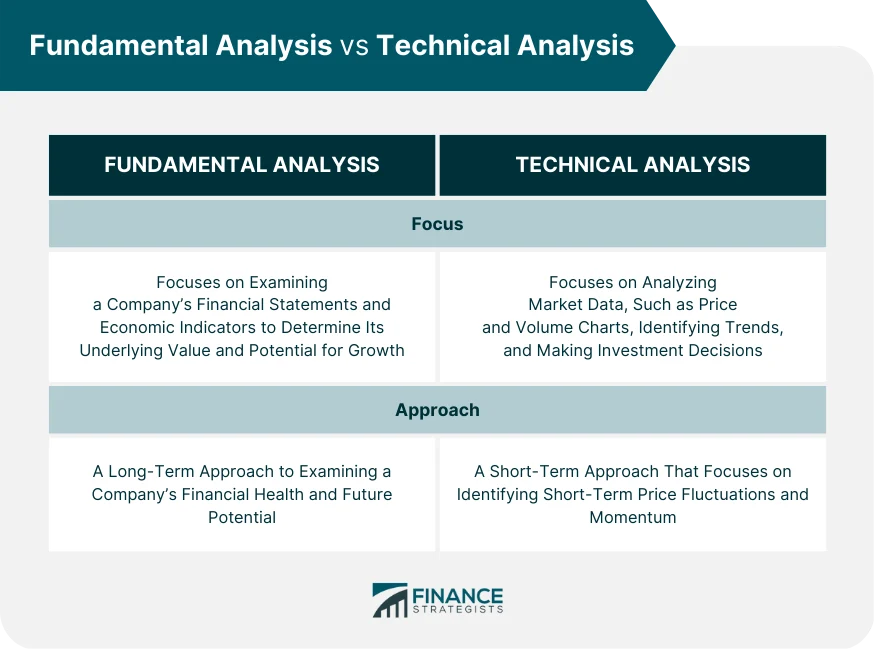
The underlying disciplines are not interchangeable. India’s securities regulator describes technical analysis as the study of price, trend, and volume, and fundamental analysis as the study of financial health, business model, and economic factors. Investopedia defines fundamental analysis as a valuation method based on financials and other objective metrics, not market-price trends. When AI erases that boundary, it also erases the investor’s ability to challenge the argument.
Regulators are watching the same blur. In March 2024 the U.S. Securities and Exchange Commission charged two advisers for false or misleading claims about their use of AI. In a February 2026 speech, the SEC’s Director of Investment Management said liability fear is still a major barrier to adoption, in part because AI is designed to move the human out of the real-time loop. If the output does not say what is known versus what is assumed, oversight becomes guesswork.
What Should You Look for in an AI Tool That Separates Technicals From Fundamentals?
You should look for structural separation, not a single “smart score.” A tool that is useful for SFA work makes the evidence type visible, keeps forecasts from reading like facts, and lets you rerun one layer without rewriting the others.
Six evaluation dimensions matter more than marketing copy:
- Role isolation. Technical work and fundamental work should be able to run as separate tasks, ideally as separate agents or modules.
- Fact grounding. Fundamental claims should point to filings, statements, or named data releases rather than unsourced summaries.
- Signal hygiene. Technical comments should stay inside price, volume, and market structure, without smuggling in “cheap” or “expensive.”
- Assumption tags. Forecasts should be named as base, bull, or bear cases, with the drivers listed.
- Memory control. The system should remember your constraints across sessions without silently merging last week’s thesis into this week’s chart read.
- Challengeability. You should be able to ask “what would falsify this?” and get a test, not a restated opinion.
Using structured fundamental and technical analysis side by side is one of the standard ways analysts reduce emotional, reactive decisions. AI should make that structure stricter, not looser.
A blended rating can still be useful as a screen. It is a weak final memo. If the product’s main output is one letter grade or one price target, you will have to reconstruct the three layers yourself.
Which AI Tools Best Isolate Technical Signals, Fundamental Facts, and Future Assumptions?
Specialized Jenova agents isolate the layers more cleanly than most single-score platforms, while dedicated charting tools remain stronger for automated technical markup. The right choice depends on whether you need labeled research, a trading overlay, or a compressed ranking.
| Feature / Dimension | TrendSpider | Jenova Specialized Agents | Danelfin | Fiscal.ai |
|---|---|---|---|---|
| Technical signal isolation | Automated trendlines, multi-timeframe scans, pattern tools | Dedicated Technical Stock Analyst focused on price, volume, and structure | Technical inputs folded into a composite AI score | Conversational; isolation depends on the prompt |
| Fundamental fact grounding | Not the primary design focus | Dedicated Fundamental Stock Analyst covering earnings, valuation, and filings | Combined with price and industry factors in one rating | Institutional financial data plus conversational AI |
| Assumption / scenario labeling | Limited; oriented to setups and alerts | User-enforced labels, plus portfolio-level stress tests | Forecasts often embedded in scores and targets | Possible in chat, not structurally enforced |
| Pricing (as of 2026) | From about $54/month | Free tier with limited usage; Plus from $20/month | From about $19/month on annual Plus | Unverified |
| Best for | Active traders who want automated chart work | Investors who need separated, reusable research layers | Users who want a single ranked AI score | Users querying a broad fundamental data set in chat |
TrendSpider
TrendSpider is strongest when the job is technical markup. Reviews describe automated trendline drawing, multi-timeframe analysis, heat maps, and customizable AI scanning, with plans commonly listed from $54 to $122 a month. That is genuine help for signal isolation.
The limitation is complementary: it is not built to keep SEC-filing facts and forward scenarios in separately labeled workstreams. If your question is “is this business worth more than the market implies,” you will still need a fundamental layer elsewhere.
Jenova Specialized Agents
Jenova’s design advantage is division of labor. The Fundamental Stock Analyst concentrates on earnings, relative valuation, business-model quality, filings, estimates, and sentiment. The Technical Stock Analyst stays inside price action, volume, momentum, and defined-risk setups. The Portfolio Management Strategist can take the third layer — allocation, drift, risk, and scenario stress tests — without rewriting the first two.
The honest limitations are just as important. Jenova is not a brokerage execution terminal, and it does not publish a multi-year third-party rating backtest comparable to some quant screens. Chart automation is also thinner than a dedicated platform such as TrendSpider. Separation quality still depends on using the agents as separate workstreams rather than asking one chat to “do everything.”
Danelfin
Danelfin is built for compressed ranking. It publishes AI scores and “best stock” lists, with paid plans listed from roughly $19 a month, and it has reported a 376% cumulative return from 2017 through mid-2025 versus 166% for the S&P 500 on its own figures. For screeners, that simplicity is a strength.
For SFA work, it is a limitation. A composite score is designed to merge earnings, cash flow, price movement, and industry context. That is the opposite of keeping facts, signals, and forecasts independently inspectable.
Fiscal.ai and Other Blended Assistants
Fiscal.ai positions itself as an all-in-one research platform that combines institutional-grade financial data with conversational AI. That data depth helps the fundamental layer. Conversation alone does not guarantee that a target price will be labeled as an assumption.
The same pattern appears elsewhere. Trade Ideas is frequently described as a real-time signal platform whose Holly system scans for setups, with pricing often listed around $127 a month](https://www.wallstreetzen.com/blog/ai-stock-analysis/). [Tickeron sells forecasts, pattern tools, and bots, with paid plans often listed from about $60 a month. Both can be useful for timing. Neither is a substitute for a filing-backed fact layer or an explicitly ranged scenario layer.
Why Does Splitting Technical and Fundamental Work Across Separate AI Agents Matter?
Splitting the work across agents prevents one narrative from laundering a weak claim into a strong one. When the same model writes the chart read, the 10-K summary, and the bull case, uncertainty in one layer infects the others.
Examining the agent split in practice shows a simple control: the technical agent can say a stock is extended above a rising 50-day average without calling it overvalued. The fundamental agent can say operating margin expanded last year without calling the breakout confirmed. Those are different statements. They should not share a verdict until a human, or a third portfolio-level pass, joins them on purpose.
Jenova’s platform features help only if you use them that way. Persistent memory can store your rule — “never put a price target in a fact section” — across sessions. Multi-model access lets you rerun the same filing extract through a second model when a number looks off. Connected search tools can pull a current 10-Q or macro release instead of relying on stale training text. The FCA specifically warns that AI answers are often outdated and should be checked against original sources.
The cost of not splitting is subtle. A blended assistant will often treat “RSI above 70” as evidence that a company is expensive, or treat a high P/E as evidence that a downtrend must continue. SEBI’s comparison is blunt on this point: technical tools such as moving averages, RSI, and Bollinger Bands serve a different job than P/E, EPS, and debt-to-equity. Separate agents make that category error harder to commit and easier to catch.
How Should You Prompt AI So It Labels Assumptions Instead of Presenting Them as Facts?
You should give the model a job description, a forbidden mix, and an output template before you give it the ticker. Prompting is the cheapest control, and it works on Jenova agents as well as on general chat tools, though specialized agents need less correction.
A reusable three-pass sequence looks like this.
- Run technicals with a closed scope:
"Technical layer only for ticker X on the daily and weekly charts. Report trend, key levels, volume, and momentum. Do not mention valuation, earnings quality, management, or price targets. Prefix every sentence with Signal."
- Run fundamentals with a closed scope:
"Fundamental layer only for ticker X. Use the latest filings and reported financials. Distinguish reported facts from analyst estimates. Do not infer next year’s growth or a fair-value target. Prefix facts with Fact and estimates with Estimate."
- Run the future as scenarios, not a point forecast:
"Assumption layer only. Give a base, bull, and bear case for the next 8 quarters. List the 4 assumptions that change across cases. Label every number as an assumption. Do not restate the technical setup as proof that a case will occur."
On Jenova, send pass one to the Technical Stock Analyst and pass two to the Fundamental Stock Analyst. Keep them in separate threads if you want the cleanest memory. Bring both outputs to the Portfolio Management Strategist only when you are ready to test portfolio impact.
On a general-purpose chatbot, add one more line: ask for sources and then open those sources yourself. The FCA’s guidance is to use AI to find where to dig, not as the final answer, and to treat confident wording as a reason to verify rather than a reason to trust.
If the model still mixes layers, stop and restart with a narrower task. Editing a contaminated memo is slower than regenerating a clean one.
How Do Multi-Scenario Techniques Keep Future Assumptions From Masquerading as Facts?
Multi-scenario techniques keep the future in the future by replacing one predicted number with a set of labeled cases. Scenario analysis is the practice of estimating outcomes under different conditions rather than relying on a single forecast.
IBM describes the usual trio as base, worst, and best cases, and stresses that teams should separate controllable variables from uncontrollable ones. A standard modeling set of assumptions includes prices, customer metrics, operating costs, and inflation. Those inputs are not facts about the present. They are switches you flip to see what breaks.
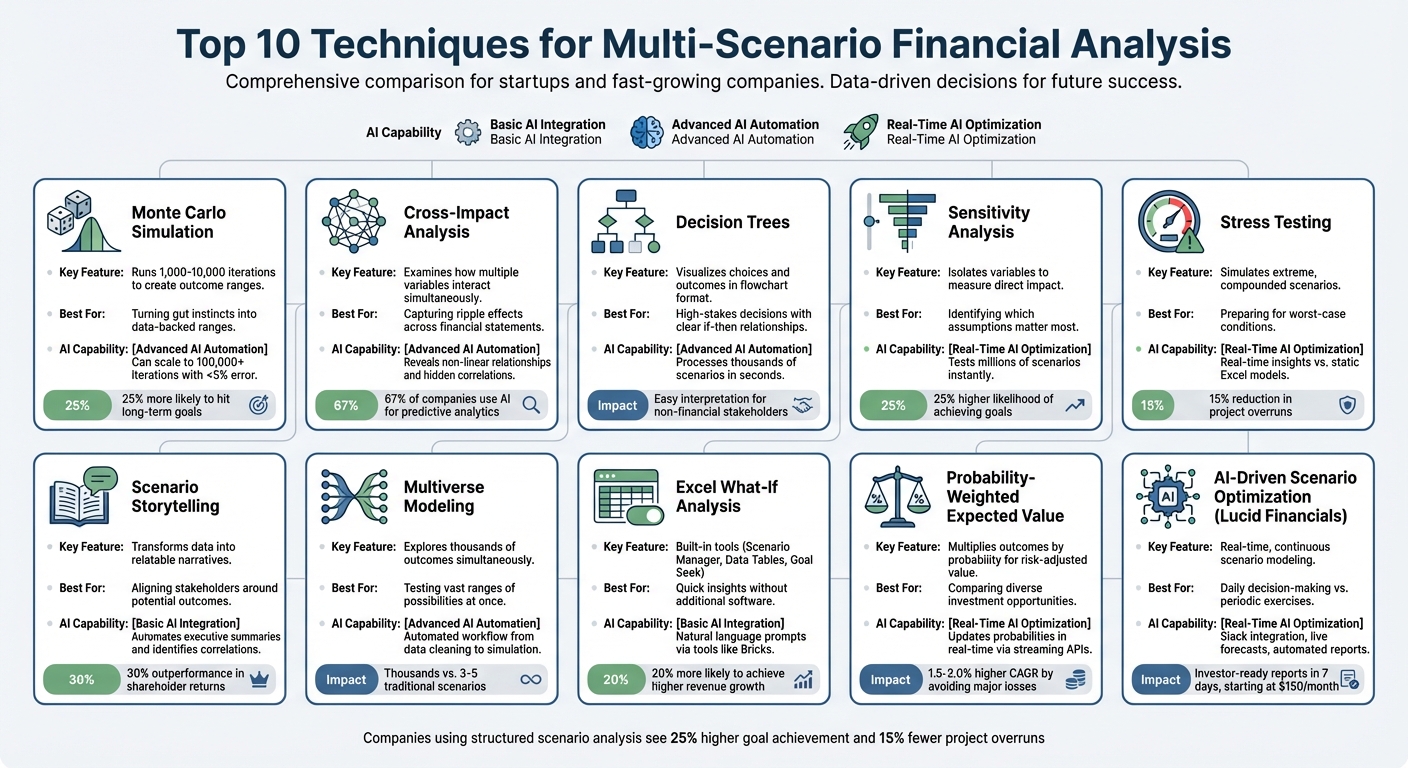
The techniques in that map are most useful when each one is assigned to the assumption layer:
- Sensitivity analysis changes one driver at a time so you can see which assumption actually matters.
- Stress testing pushes several drivers to an ugly combination and asks whether the position still survives.
- Monte Carlo-style simulation turns a few ranges into a distribution of outcomes instead of a single target.
- Decision trees make the sequence of if-then choices visible, which stops a narrative from hiding its branches.
- Probability-weighted value is only honest if the probabilities are labeled as judgments, not measurements.
IBM also notes that AI can now generate and test hundreds or thousands of scenarios in minutes, replacing static spreadsheet cycles. Speed is not the same as discipline. If the model dumps a “most likely price” at the top of the page, the scenarios underneath become decoration.
A clean rule: no assumption may appear in the fact section, and no technical signal may be used as proof that a scenario will occur. Signals can time an entry. They cannot certify a 2028 margin.
The FCA is explicit that AI is analytical, not psychic, and cannot predict crashes or sudden events. That sentence belongs at the top of every assumption section.
What Do Investment Research Experts Say About Separating Evidence From Forecasts?
Investment researchers increasingly treat AI as a compression engine for text and data, not as an oracle, and they want the uncertainty left visible. The useful expert consensus in 2025–2026 is not “AI picks better stocks.” It is “AI is dangerous when it sounds finished.”
"The failure we see most often is register collapse. A model will place last quarter’s free-cash-flow margin, a weekly RSI reading, and a 12-month price target in the same paragraph, with the same verbs and the same confidence. Once that happens, the investor is no longer reading analysis. They are reading a story that has already decided which facts are allowed to matter. The fix is unglamorous: three headings, three prefixes, and a ban on letting a forecast borrow the authority of a filing."
"Specialized agents help because they change the default question. A technical agent is not being asked whether the business is high quality. A fundamental agent is not being asked whether the breakout is valid. When those jobs share one prompt window, the model optimizes for coherence. Coherence is exactly what you do not want if the chart and the balance sheet disagree."
"Scenario work only earns its keep when the assumptions are extractable. If you cannot list the four switches that move the bear case, you do not have a bear case. You have a mood. We would rather see a narrow, sourced fact section and an explicitly fragile forecast than a polished memo that hides the joints."
— Jenova Product Team, designers of specialized equity-research agents
That view lines up with outside research without copying its marketing. BlackRock has described large language models as a way to extract investment insight from textual data, not as a replacement for judgment. A Stanford Graduate School of Business report on an AI stock-picking experiment found strong results from public information, but the setup still depended on a defined process rather than free-form chat. Process is the point.
How Do You Audit an AI Investment Memo for Mixed Evidence?
You audit it by forcing every sentence into one of the three SFA buckets and rejecting any sentence that cannot choose. This is the operating routine that makes the rest of the framework real.
Use this pass on a Jenova memo or on a note from another platform:
- Highlight the verbs. “Reported,” “filed,” and “printed” belong in facts. “Broke out,” “held,” and “diverged” belong in signals. “If,” “implies,” and “would” belong in assumptions.
- Strip orphan numbers. A multiple, margin, or price with no date and no source is not a fact yet.
- Separate estimates from results. Consensus EPS is not earnings. Guidance is not a result. Label both.
- Kill borrowed proof. If the bull case cites RSI as evidence the company will grow faster, the layers have leaked.
- Write the disagreement. A usable memo states where the technical picture and the fundamental picture do not match.
- Add a falsifier. Each assumption needs one observation that would retire it.
A short starter workflow on Jenova takes a few minutes:
- Open the Technical Stock Analyst and run the signal-only prompt.
- Open the Fundamental Stock Analyst with the latest filing attached or cited, and run the fact-only prompt.
- Open the Portfolio Management Strategist with both outputs pasted as labeled exhibits, not as a blended summary.
- Ask for three portfolio-level scenarios and the assumptions that move them.
- Save the three exhibits. Next session, update only the layer that changed.
If you are using TrendSpider or a signal terminal instead, keep that output in the signal exhibit and do not let it rewrite the filing summary. If you are using Danelfin or another scored screen, treat the score as a search filter, then rebuild SFA from primary sources.
Canadian regulators have summarized research showing AI can improve some earnings-change prediction tasks, while still framing these as use cases rather than guarantees. Better average prediction does not authorize a mixed memo. The investor’s edge is not a more confident paragraph. It is knowing which sentences would still be true if the forecast is wrong.
References
- Financial Conduct Authority — Using AI for investment research
- SEBI Investor Education — Technical Analysis vs. Fundamental Analysis
- Investopedia — Fundamental Analysis: Principles, Types, and How to Use It
- U.S. Securities and Exchange Commission — Charges two advisers over false AI-related statements
- SEC Division of Investment Management — Artificial Intelligence and the Future of Investment Management (David W. Blass Daly, 2026)
- Daloopa — Guide to Fundamental Analysis vs Technical Analysis
- WallStreetZen — AI For Stock Analysis: The 7 Best AI Stock Analyzers in 2026
- TrendSpider — Market research and trading platform
- Danelfin — AI stock analytics platform
- Fiscal.ai — AI-powered investment research platform
- Tickeron — AI tools for stock forecasts and price predictions
- Investopedia — Scenario Analysis Explained
- IBM Think — What is Scenario Analysis?
- Corporate Finance Institute — Scenario Analysis
- BlackRock — How AI is Transforming Investing
- Stanford Graduate School of Business — An AI Analyst Made 30 Years of Stock Picks
- Ontario Securities Commission — Artificial Intelligence and Retail Investing