How Can AI Build Pre-Earnings Base, Bull, and Bear Scenarios?
2026-08-24
What Makes an AI Pre-Earnings Scenario Framework Decision-Grade?
A decision-grade AI scenario stack does not invent three prices. It first verifies the print, the consensus tape, and the company’s own constraints, then flexes a small set of causal drivers into a base case, a legitimate-but-pessimistic bear case, and an optimistic-but-plausible bull case. In 2026, that workflow is strongest when a research agent such as Jenova’s Fundamental Stock Analyst synthesizes SEC filings, analyst estimates, and a written thesis, while terminals such as Koyfin and TIKR remain stronger at long estimate histories and statement-level browsing.
What separates a usable pre-earnings memo from spreadsheet theater:
✅ Event identity is locked first — fiscal period, GAAP versus non-GAAP, and report date are confirmed before any number is flexed, a step post-earnings model checklists treat as non-negotiable.
✅ Scenarios are thesis-driven, not mood-driven — each case is a specific story about growth, margins, reinvestment, and dilution, not “everything up” versus “everything down,” as scenario valuation practice now emphasizes.
✅ The consensus tape is treated as a distribution — average, low, high, analyst count, and revision direction, not a single EPS print.
✅ Implied multiples are used as sanity checks — if the bull case requires a peer-impossible multiple, the scenario is internally inconsistent even if the math ties out.
✅ Risk is not double-counted — worse fundamentals and a sharply higher discount rate are not stacked unless both can be justified independently.
To compare tools honestly, it helps to separate data terminals from scenario engines, then list the inputs that must be verified before any AI output is trusted.
Why Does Pre-Earnings Scenario Work Matter More in 2026?
Pre-earnings scenario work matters more now because the market still prices the gap between reported results and the published consensus, and that consensus is wider, faster-moving, and more visible than a single-point model can capture. Wall Street analysts build forward earnings models from revenue and cost assumptions, and databases publish both individual forecasts and a consensus that is typically the average or median of those forecasts.
Investors watch the difference between that consensus and the actual print. Prices move when a company exceeds or falls short of the published estimate. A single “target price” therefore answers the wrong question the night before a report. The useful question is what must be true in the base case, what breaks the thesis in the bear case, and which evidence would make the bull case more likely after the call.
Scenario analysis exists to evaluate distinct future states and their financial consequences, not to decorate a base case with arbitrary plus-or-minus percentages. Equity practitioners increasingly treat the three-case range as clearer and more defensible than a black-box simulation for most single-stock debates, because each assumption can be challenged in plain language rather than buried in a distribution.
The 2026 data environment makes that discipline harder and more valuable at the same time. Estimate platforms now expose years of revisions, surprise history, and price-target ranges to non-institutional users. Without a verification layer, AI will confidently remix stale guidance, mixed GAAP definitions, or the wrong fiscal period.
What Should You Look for in an AI Pre-Earnings Scenario Tool?
You should look for a tool that can lock the reporting event, ingest a consensus distribution, read primary filings, and write internally consistent driver narratives — not merely chat about a ticker. The evaluation framework below, which this article calls the Pre-Print Integrity Test, weights six dimensions that actually change the quality of a scenario memo.
1. Event control. The system must confirm which fiscal period is being printed, whether the company reports on a calendar or trailing fiscal year, and whether the estimate tape is GAAP or “Street” / non-GAAP. Mixing those definitions is one of the most common ways a scenario becomes fiction.
2. Consensus texture. A usable tape includes average, low, and high estimates, the number of contributing analysts, year-ago actuals, and the direction of recent revisions. A single consensus EPS figure is not a scenario input. It is a headline.
3. Primary-document access. U.S. registrants must file annual reports on Form 10-K and quarterly reports on Form 10-Q. An AI that cannot ground claims in those filings, plus the 8-K earnings release, is summarizing secondary commentary.
4. Driver sparsity. Serious scenario work flexes the 6–10 levers that actually move value — growth, margins, reinvestment, discount rate, terminal value, and dilution — rather than perturbing every line item.
5. Cross-checks. Each case should produce per-share value and a small set of implied multiples so the story can be compared with peers and with the current price.
6. Memory and refresh rules. The tool should remember the last verified share count, guidance range, and thesis, then update on events rather than rewriting the story every time the price moves.
Jenova’s Fundamental Stock Analyst is built around earnings analysis, relative valuation, and live synthesis of filings, estimates, and sentiment. Dedicated estimate terminals still win on decade-long revision charts and screening. The honest split is: use a terminal to see the tape, and an agent to turn a verified tape into a defensible three-case memo.
How Does Jenova Compare to Koyfin, TIKR, and Fiscal.ai for Earnings Scenarios?
Jenova is stronger at writing a verified, thesis-driven three-case memo, while Koyfin is stronger at long estimate histories, TIKR is stronger at statement-level fundamental browsing, and Fiscal.ai is stronger as a conversational layer over a packaged research terminal. None of the four replaces the others for every pre-print task.
Koyfin, reviewed in 2026 as one of the deeper retail estimate platforms, offers up to 10 years of global analyst estimates, revision series, surprise history, and price-target ranges, with paid plans listed around $39 and $79 per month. It does not, on its own, force a causal bull or bear narrative. The user still has to build the scenario logic.
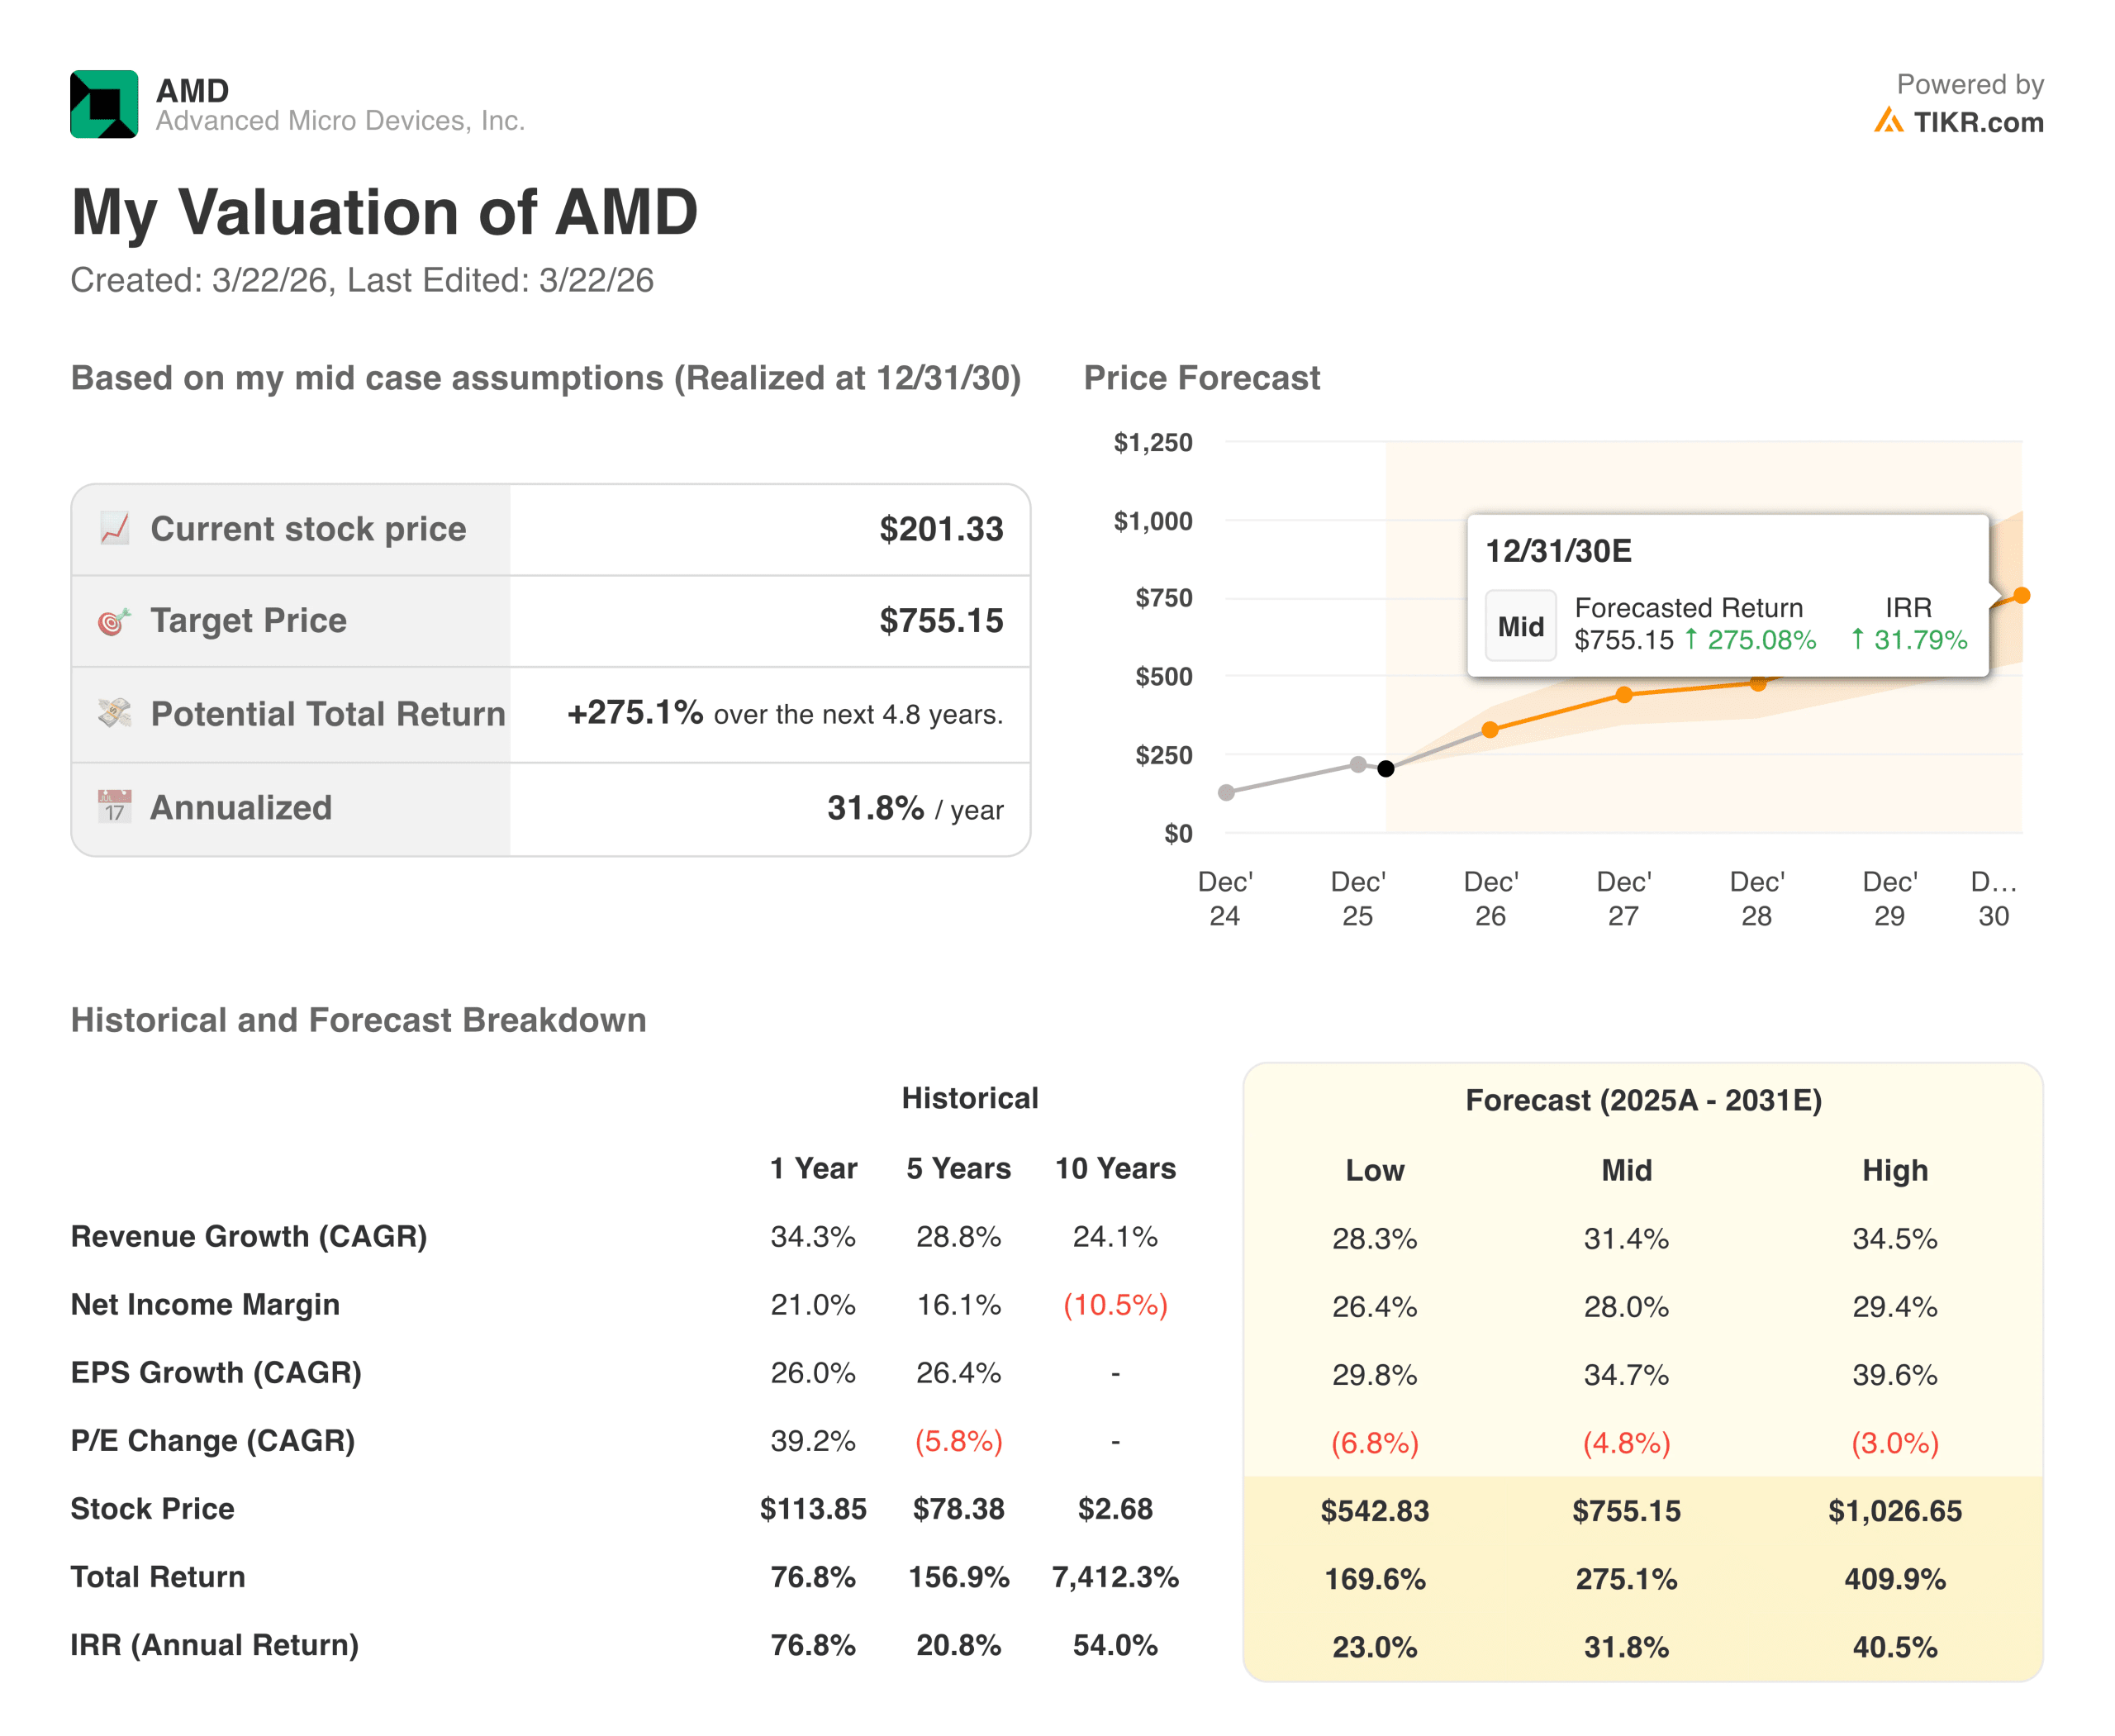
TIKR is widely used for fundamental statement work and, as of that same 2026 comparison, provides about five years of estimates, management-guidance display, and coverage marketed at more than 100,000 stocks across 92 countries. The free version is U.S.-centric, and price targets are not fully exposed in the screener. The AMD valuation image above is a TIKR-powered example of a finished low / mid / high output — useful as a format, not as a substitute for checking every assumption.
Fiscal.ai positions itself as an all-in-one research platform that combines institutional-grade financial data with conversational AI. Public pricing was not verified at the time of writing. Conversational access to a data warehouse is not the same thing as a governed scenario stack with consistent dilution and documented drivers.
Seeking Alpha packages price targets, ratings history, and a limited estimate set behind a Premium plan listed at $239 per year in the same 2026 survey. It is stronger as a mosaic of opinions than as an auditable three-case model. Perplexity Finance is useful for fast sourcing and weaker as a persistent valuation workbook.
| Feature / Dimension | Koyfin | Jenova Fundamental Stock Analyst | TIKR | Fiscal.ai |
|---|---|---|---|---|
| Estimate history | Up to 10 years, global | Live consensus plus filing synthesis | About 5 years | Packaged institutional data |
| Scenario construction | User-built from series and charts | Thesis-driven base / bull / bear memo | User-built from statements | Conversational queries over data |
| Primary documents | Filings and transcripts on paid plans | SEC filings, estimates, and sentiment inside the agent | Guidance and financials emphasized | Filings plus analytics layer |
| Sanity checks | Surprise charts, target ranges | Implied multiples and driver narratives | Low / mid / high model outputs | Depends on user prompt |
| Persistence | Dashboards and watchlists | Cross-session memory of thesis and inputs | Saved models / watchlists | Unverified |
| Pricing (as of 2026) | Free; paid about $39–$79 / mo | Free; paid from $20 / mo | Free U.S.; paid for full global | Public pricing unverified |
| Best for | Revision trends and estimate screening | Pre-print scenario memos | Deep fundamental browsing | Conversational terminal research |
Jenova’s honest limitation is depth of native estimate history and screening. It is not a 10-year revision charting product, and it is not a substitute for EDGAR when a filing must be cited in a compliance file. Koyfin’s limitation is the opposite: rich tape, thin narrative discipline unless the user supplies it.
How Does AI Actually Construct Base, Bull, and Bear Cases?
AI constructs credible cases by writing one clean base case first, naming the 6–10 drivers that explain most of the value, then flexing only the drivers that represent a specific upside or downside thesis. A base case is not a copy of management guidance. It is the analyst’s best unbiased view using consistent logic. The bear case is a legitimate-but-pessimistic outcome; the bull case is optimistic but still plausible.
The mechanical sequence looks like this:
- Lock the lens. Choose discounted cash flow, an earnings-power / multiple model, or a hybrid, and keep that lens identical across all three cases.
- Freeze share count. Fully diluted shares, buybacks, convertibles, and equity-plan issuance must be consistent. Scenario outputs become noise if dilution changes silently between cases.
- Write three causal sentences. Base: “Demand tracks current backlog conversion and margins hold near the trailing mix.” Bull: “The upside thesis plays out — mix, pricing, or volume beats the guided range for a defined number of periods.” Bear: “The key risk materializes — pricing, share loss, or cost inflation hits the named driver.”
- Flex drivers, not vibes. Raise duration of growth or operating leverage in the bull case. Pull forward margin normalization or working-capital drag in the bear case.
- Refuse stacked disasters. If the bear case already cuts growth, do not also inflate the discount rate unless risk itself has changed.
- Publish implied multiples. Enterprise value, equity value, per-share value, and implied P/E or EV/EBITDA are the output set that makes the case reviewable.
- Assign rough probabilities. A simple worked pattern is base 50%, bull 25%, bear 25%. If base value is $100, bull $130, and bear $70, expected value is $100 — the point is the range and the triggers, not a false sense of precision.
The AMD figure above shows the format investors actually use: a mid-case target, a low case, a high case, and the growth, margin, and multiple paths that produce each price. In that example, the mid case compounds a large return through 2030 only if revenue growth stays in the low-thirties and the multiple does not collapse. That is a claim about drivers, not a slogan about the stock.
A practical prompt inside Jenova’s Fundamental Stock Analyst looks like this:
"Build base, bull, and bear cases for this ticker ahead of the next print. Write one causal sentence per case. Flex only revenue growth, operating margin, reinvestment, terminal multiple, and diluted share count. Do not change the discount rate unless you can name an independent risk-premium reason. Show implied P/E and EV/sales for each case."
Generic chatbots skip the freeze-the-event step and produce three stories that cannot be audited. Specialized agents are useful only when that prompt is paired with the verification list in the next section.
Which Data Must Be Verified Before Any Scenario Is Trusted?
Six data layers must be verified before an AI scenario is treated as decision-grade: the event identity, the consensus tape, company-issued constraints, filing-grade fundamentals, driver evidence, and market-implied checks. This article calls that list the Pre-Print Verification Stack. Skipping any layer is how a fluent memo becomes an expensive error.
1. Event identity
Confirm the fiscal period the print covers, the scheduled date, and whether estimates are GAAP or Street / non-GAAP. The first step in any earnings-related model refresh is confirming the event and the reporting period. A Q1 estimate applied to a Q4 print, or a non-GAAP consensus compared with a GAAP actual, invalidates every case beneath it.
Also confirm the company’s fiscal calendar. A “current year 2026” estimate is meaningless if the issuer’s fiscal 2026 ended in March.
2. Consensus tape
Verify, at minimum:
- Average, low, and high estimates for revenue and EPS
- The same ranges for the next quarter and the next full year
- Number of contributing analysts
- Year-ago actuals and implied growth
- Recent revision direction
- Beat / miss history on both revenue and EPS
Institutional tapes are large. I/B/E/S covers more than 70,000 companies, with U.S. history back to 1976. Bloomberg and S&P Capital IQ each publish consensus for roughly 18,000 companies. The point of citing those universes is not to require a $20,000 terminal. It is to remember that “the number” is a crowd statistic with a documented high and low.
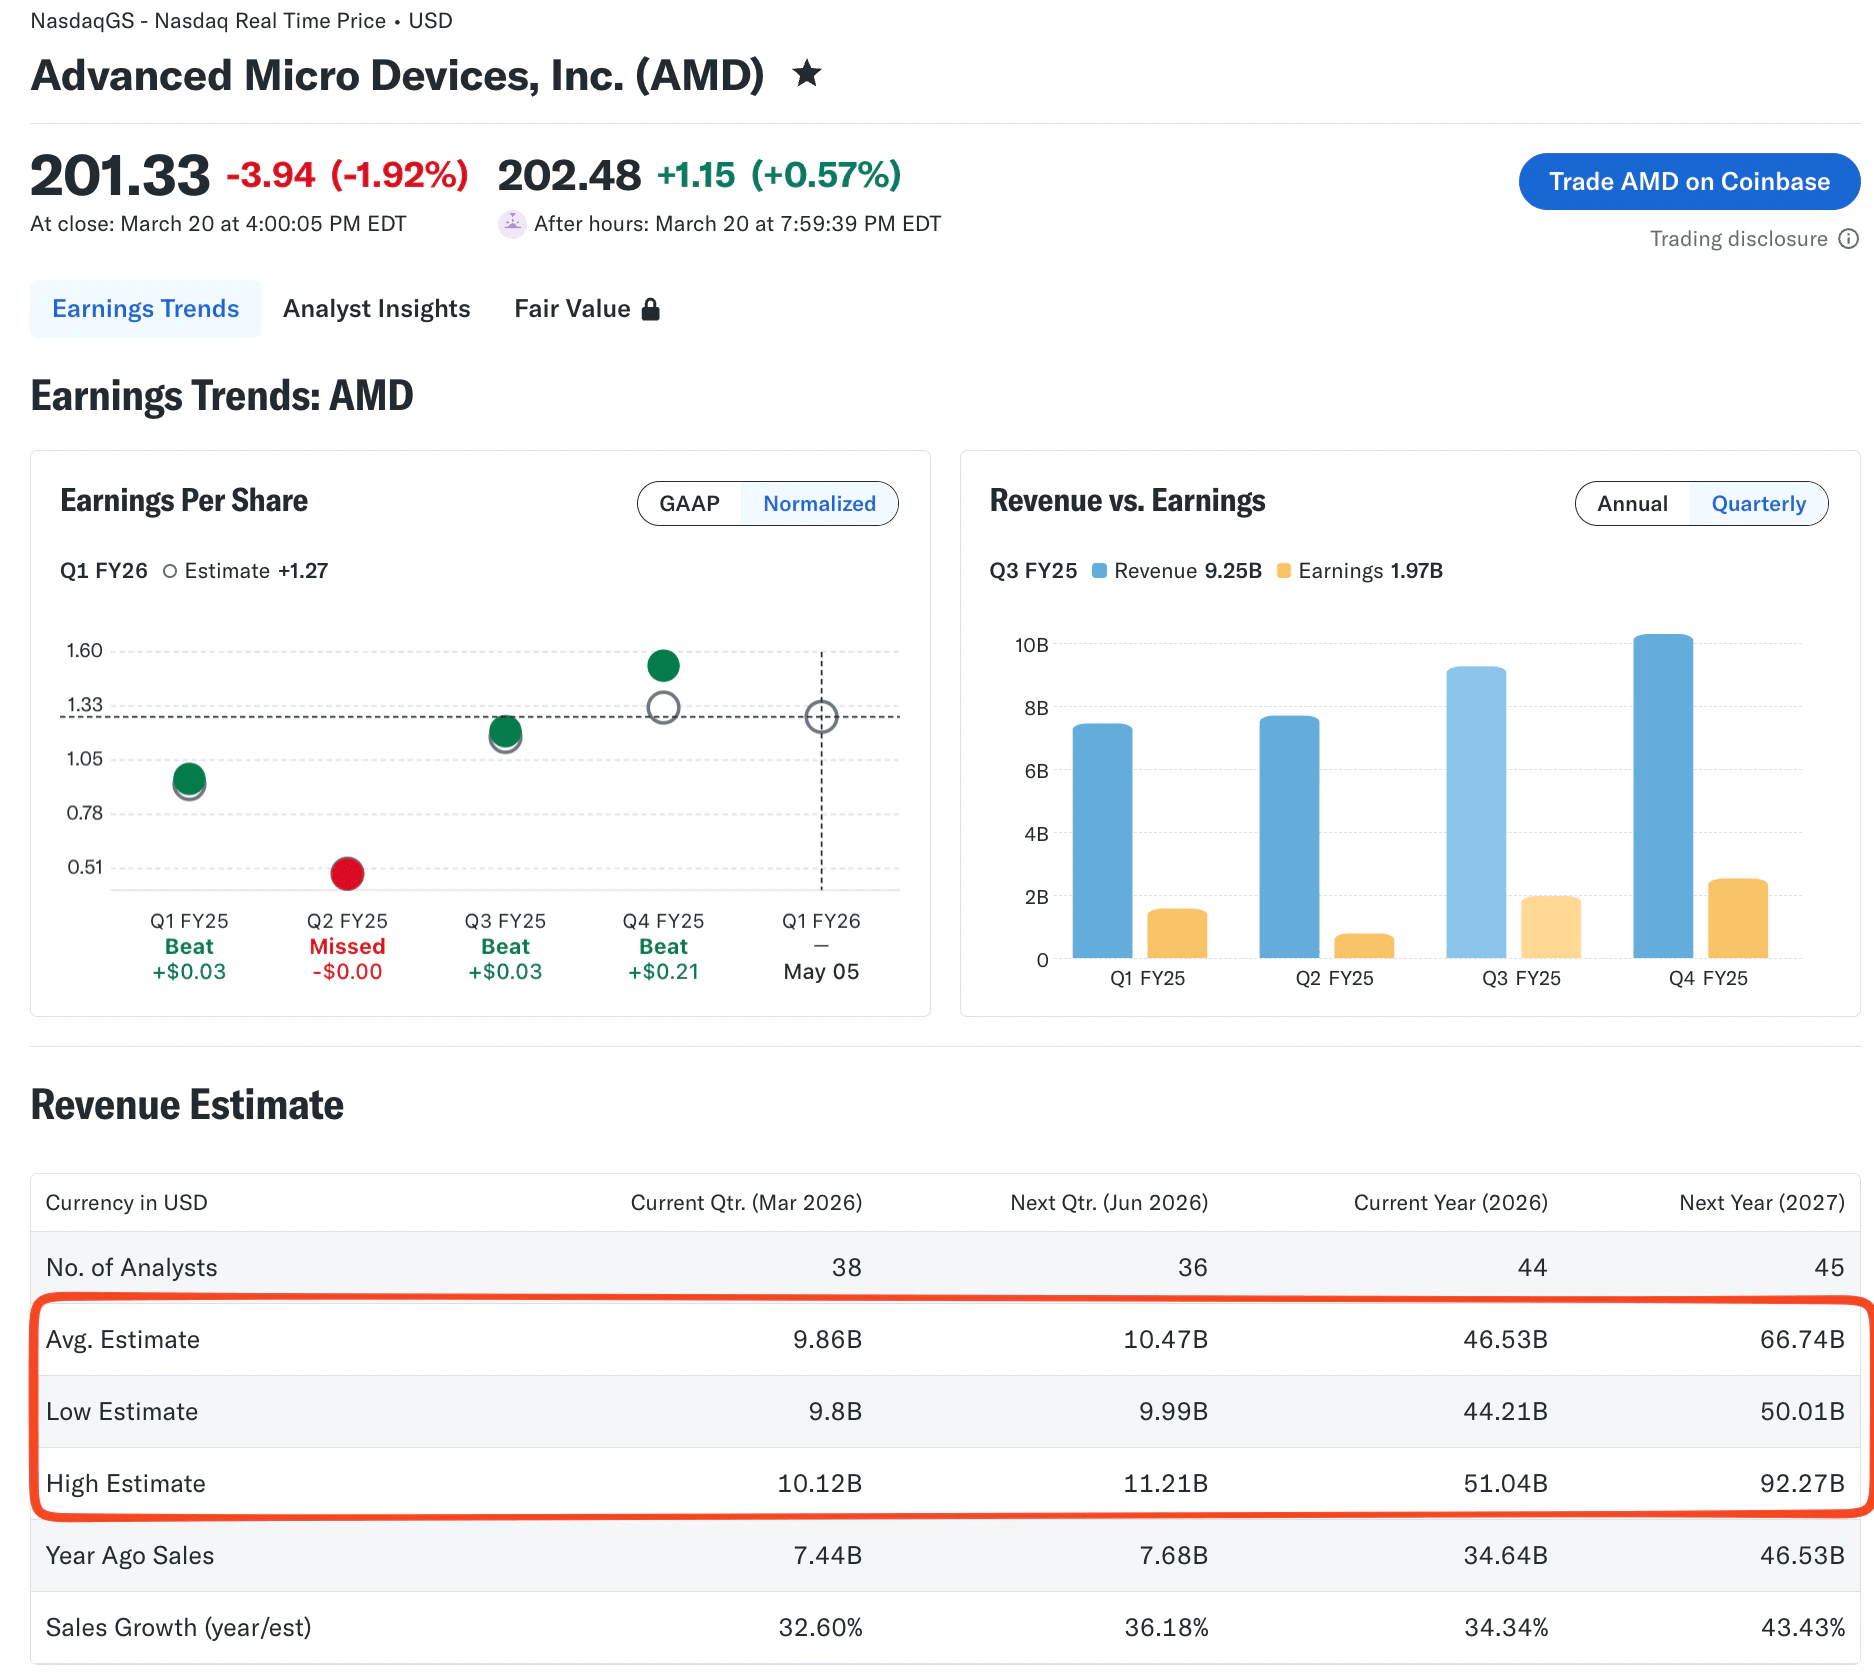
The AMD tape in the figure is the right shape: 38 analysts on the current quarter, a $9.86 billion average against a $9.8–$10.12 billion range, full-year 2026 average revenue of $46.53 billion versus a $44.21–$51.04 billion span, and 2027 still wider at $50.01–$92.27 billion. A base case that ignores that 2027 dispersion is pretending the Street agrees when it does not.
3. Company-issued constraints
Pull the last guided ranges, segment commentary, and any “rules of the road” management repeated on prior calls. Guidance is a constraint, not a base case. If management guided operating margin to a band, the bear case should say how the company misses that band, not invent a new accounting definition.
Transcripts and the 8-K release are the primary sources. Secondary recaps are useful only after the primary text is checked.
4. Filing-grade fundamentals
From the latest 10-K and 10-Q, verify:
- Revenue recognition policy and any restatement language
- Segment mix and geographic mix
- Gross margin and operating-margin bridges
- Capex, depreciation, and working-capital turns
- Net debt, cash, and lease liabilities
- Diluted weighted-average shares, buyback authorization, convertibles, and stock-based compensation
- Tax rate and one-time items that will not repeat
- Related-party, legal, and going-concern disclosures
Forms 10-K, 10-Q, and 8-K remain the core public record for those items. They are searchable in EDGAR. An AI summary that cannot point back to the filing is a draft, not an input.
5. Driver evidence
This is the non-commodity layer. Verify the operating facts that justify flexing a driver:
- Unit volumes, average selling prices, and backlog or remaining performance obligations
- Customer concentration and channel inventory
- Commodity, foundry, freight, or labor cost paths
- FX translation versus organic growth
- Regulatory, export-control, or reimbursement changes
- Competitor pricing and share shifts
- Capex timing versus depreciation
Without this layer, bull and bear cases are just consensus plus or minus a round number.
6. Market-implied sanity checks
Before you accept the range, check:
- Implied P/E, EV/EBITDA, and EV/sales in each case versus the current peer set
- Whether the bull multiple has any historical precedent for this business
- Options-implied move into the print, if you trade around the event
- Short interest and borrow, if the bear case assumes a gap down
- Peer prints already released in the same cycle
A bull case should argue why the valuation is reasonable relative to the growth being assumed. If it cannot, the scenario is a wish.
A verification prompt that belongs in the same thread:
"Before you build cases, list every item in the Pre-Print Verification Stack for this ticker. Flag anything you cannot confirm from the latest 10-K, 10-Q, 8-K, or the current consensus tape. Do not invent a missing low/high estimate."
Jenova can assemble that list quickly and remember it across sessions. It cannot certify that an unfiled number is correct. That limitation is the feature: a trustworthy agent refuses to paper over a hole in the stack.
How Do You Run a Complete Pre-Earnings Scenario Workflow With AI?
A complete workflow takes a verified tape, writes three internally consistent cases, assigns monitoring triggers, and only then discusses position size. The steps below work in Jenova and, with more manual assembly, in a Koyfin-plus-spreadsheet stack.
Step 1 — Create the event brief. Name the ticker, fiscal period, report date, and estimate basis. Attach or point to the last 10-Q, the prior earnings 8-K, and the current consensus table.
Step 2 — Run the Verification Stack. Require the agent to return “confirmed,” “conflicted,” or “missing” on each of the six layers. Conflicted items — for example, a Street EPS that excludes stock-based compensation while your model does not — get resolved before any case is numbered.
Step 3 — Draft the base case as if it must stand alone. Build one auditable base case before creating bull and bear variants. If you would not defend the base case by itself, the range around it is decoration.
Step 4 — Add bull and bear as thesis deltas. Change only the drivers that belong to the story. Keep dilution math identical unless the case itself changes issuance or buybacks.
Step 5 — Publish the decision table. For each case, record value per share, implied multiples, the two or three metrics that would make that case more likely, and a probability. Then compute expected value. Do not treat expected value as a price target; treat it as a weighted reading of your own assumptions.
Step 6 — Set refresh rules. Rerun on the print, on guidance changes, and on material driver news. Do not rerun because the stock moved 3% in the afternoon.
Step 7 — Hand off adjacent questions. Macro context — rates, dollar, and cycle — can be checked with Jenova’s Macro Strategist. If the print is an options event, the Options Strategist can translate the same three cases into defined-risk structures. Portfolio-level exposure after the print belongs with the Portfolio Management Strategist. Those are separate jobs. Mixing them into one unfocused prompt is how scenario discipline collapses.
On Koyfin, the same workflow starts in the estimate and surprise dashboards, then moves to a spreadsheet for driver flex. On TIKR, it starts in the model and guidance views. The AI advantage is not skipping those screens. It is forcing the causal sentences and the verification flags that most spreadsheets never write down.
A compact end-to-end prompt:
"You are preparing a pre-earnings brief. (1) Verify event identity, consensus tape, last guidance, diluted share count, and the last 10-Q margin bridge. (2) Write base, bull, and bear cases with one causal sentence each. (3) Output a table of revenue, EPS, operating margin, diluted shares, value per share, and implied P/E. (4) List two monitoring triggers per case. (5) Mark every unverified input."
Jenova’s free tier includes that workflow at limited usage; paid plans start at $20 per month with 30× the free allowance. Koyfin’s paid estimate depth starts near $39 per month as of the 2026 platform survey. Neither fee replaces reading the filing.
What Do Equity Research Practitioners Say About Scenario Discipline?
Practitioners who survive more than one earnings cycle treat scenarios as a monitoring system, not as a prediction contest, and they are harsher about unverified inputs than about inelegant models.
"The failure mode we see in AI-assisted earnings work is not bad arithmetic. It is a fluent base case built on the wrong period, the wrong share count, or a Street EPS definition the model never declared. If the agent cannot show the fiscal period, the GAAP-versus-non-GAAP choice, and the diluted share count before it prints a target, the rest of the memo is theater."
"Three cases only help when each case is a thesis. ‘Revenue plus 5%’ is not a bull case. A bull case says which product mix, price, or cost item moved, over how many periods, and what multiple that still implies versus peers. If the implied multiple has no precedent, we send the case back, even when the DCF ties out."
"The verification stack is the product. Consensus high/low, last guided range, last 10-Q working-capital turn, and the buyback or convertible schedule will change a 2030 price far more than another adjective in the narrative. We would rather have a narrower, fully sourced range than a wide range with two silent holes."
— Jenova Product Team, equity-research workflow design, 8 years building agent-assisted investment research
That view matches the documented practitioner warning that terminal value and discount-rate tweaks often hide a thin operating story. It also matches the older research observation that analyst forecasts themselves do not fully incorporate information already in prices. An AI that only averages those forecasts inherits the same blind spot unless the verification stack brings filings and operating evidence back in.
How Should Pre-Earnings Scenarios Change What You Do After the Print?
Scenarios should change after the print only when a named driver or a named constraint has changed, and they should change the size of the bet more often than they change the story. If the company beats on revenue for the reason your bull case specified, the rational update is to raise the probability of that case, not to invent a new personality for the stock.
Use three post-print rules:
- Confirm the actuals against the same definitions you used pre-print. A model refresh that starts by replacing inputs before confirming the period and the metric definitions will corrupt the next quarter’s cases.
- Score the call against triggers, not against the stock’s after-hours print. Guidance withdrawn, a margin bridge that contradicts the bull mix, or a share-count surprise matters more than a 4% move.
- Keep the three theses stable until evidence forces a rewrite. Price is not evidence that the bear thesis was wrong. It is one more output.
For investors who express the view with options, map each case to a defined payoff before the event and again after implied volatility collapses. For portfolio managers, the useful artifact is not the mid-case price. It is the list of positions whose theses were actually tested by this print.
AI earns its place in that loop by keeping the last verified stack, the last three causal sentences, and the last trigger list in one thread. It does not earn its place by declaring a winner at 4:01 p.m.
References
- U.S. Securities and Exchange Commission — EDGAR company filings search
- Financial Modeling Prep — Post-earnings data refresh checklist for financial models
- Model Reef — How to create a bull, base, and bear valuation for one stock
- Investopedia — The role of earnings forecasts in stock valuation
- Baruch College Newman Library — Earnings estimates, guidance, and call transcripts
- Corporate Finance Institute — Scenario analysis definition and process
- U.S. Securities and Exchange Commission — Exchange Act reporting, Form 10-K and Form 10-Q
- Koyfin — Best platforms for earnings estimates, price targets, and analyst ratings in 2026
- Fiscal.ai — AI-powered investment research platform
- Perplexity Finance — AI research interface for markets
- Pomegra — Modeling bull, bear, and base cases
- Investopedia — Essential SEC filings for investors
- Calypso Copilot — Bull case vs. bear case evaluation framework
- ScienceDirect — Do analysts’ earnings forecasts incorporate information in price changes