Free AI for Technical Stock Analysis: Real-Time Chart Patterns, Market Structure & Momentum Signals
2026-02-15
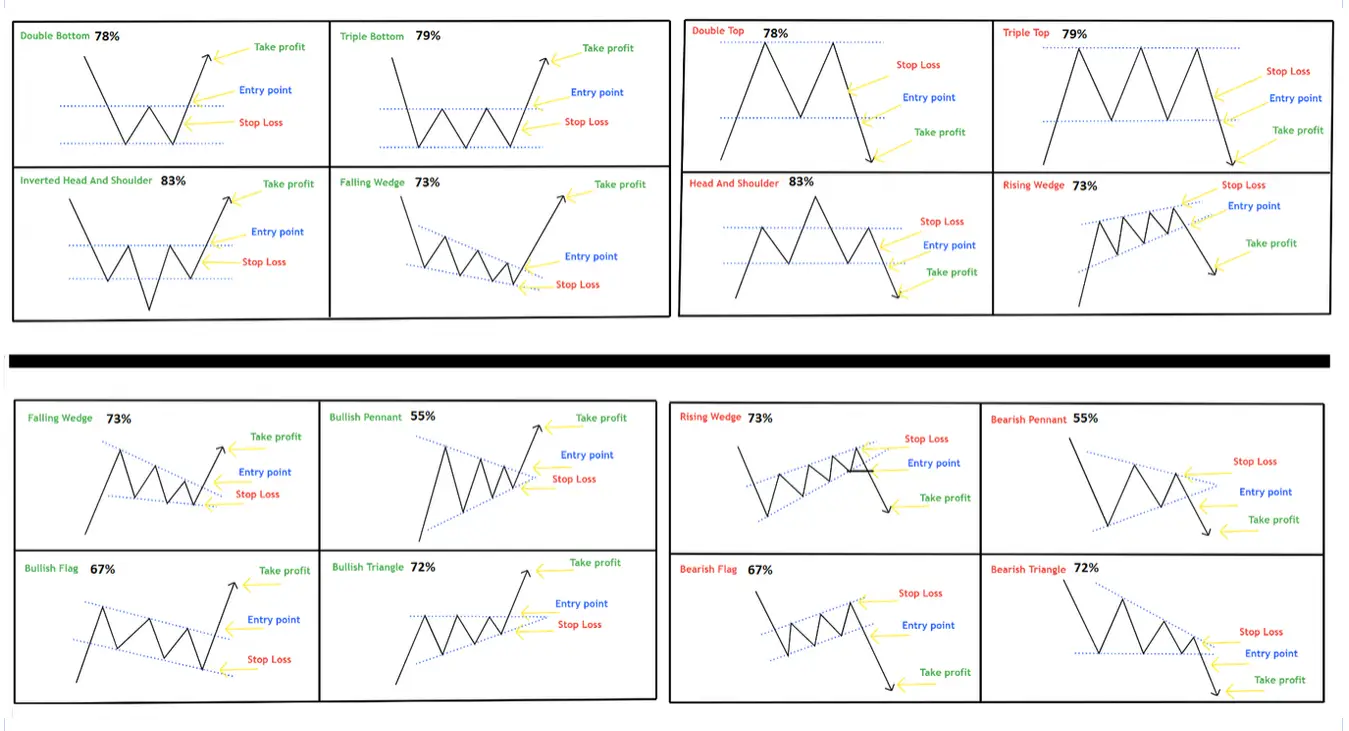
Looking for a free AI for technical stock analysis that goes beyond basic indicator readings? Technical Stock Analyst AI delivers institutional-grade chart analysis, pattern recognition, and market structure insights in seconds—helping you interpret what price action actually means in context. Over 52,000 traders have already used this tool to cut through conflicting signals, with users reporting they now understand why setups work rather than blindly following indicator alerts.
The timing is critical. According to Forbes, algorithmic trading revenues hit $10.4 billion in 2024** and are projected to reach **$16 billion by 2030. Meanwhile, The TRADE reports that 2026 is "the year that AI truly starts to power how clients and trading venues interact." Yet most retail traders still lack the analytical frameworks that separate consistent performers from the crowd.
What you get at no cost:
- ✅ Real-time support/resistance zone identification with volume profile analysis
- ✅ Multi-timeframe trend structure assessment (daily, weekly, monthly)
- ✅ Pattern recognition with confluence scoring (1-5+ signal alignment)
- ✅ Relative strength analysis vs. market and sector benchmarks
- ✅ Specific entry, target, and invalidation levels for every setup
Quick Answer: What Is the Best Free AI for Technical Stock Analysis?
Technical Stock Analyst AI is a free AI-powered technical analysis tool that interprets price action, identifies chart patterns, and delivers actionable trading signals with specific levels in seconds—available 24/7 without subscription fees for basic access.
Unlike charting platforms that display indicators without interpretation, this AI explains what patterns mean in context, rates signal confluence, and provides the reasoning behind every setup.
Key capabilities available for free:
- Identifies regime context (trending vs. ranging) before interpreting indicators
- Locates liquidity zones and potential trap setups
- Provides confluence-based signal strength ratings
- Includes specific invalidation levels for every setup
- Analyzes relative strength vs. SPY/QQQ and sector ETFs
- Cites sources for verification
The Technical Analysis Gap: Why Most Retail Traders Struggle
Despite unprecedented access to charting tools and trading platforms, most retail traders fail to translate technical analysis into consistent results. The data reveals a troubling disconnect between tool access and analytical understanding.
Retail Participation Has Exploded—But Has Skill?
The numbers are striking. Retail investors now account for 20-35% of daily trading volume in the US, UK, and South Korea—and even higher percentages in India (40%) and China (80%), according to the World Economic Forum. Reuters reports that cash poured into US stocks by retail investors in 2025 is up 53% from the previous year.
Yet access doesn't equal success. The core challenges remain:
📊 Information Overload Without Context
Modern trading platforms offer dozens of indicators—RSI, MACD, Bollinger Bands, Stochastic, ADX—but most traders don't understand that the same indicator reading means different things in different market regimes.
An RSI above 70 in an uptrend signals strength, not reversal. In a downtrend, it might indicate a temporary bounce within a bearish structure. Without regime identification, traders misinterpret signals constantly.
According to Dhan's 2026 trading indicators guide, the most effective traders combine multiple indicator types—trend, momentum, volatility, and volume—rather than relying on any single signal. Yet most retail traders lack the framework to synthesize these inputs.
📉 Strategy Overcrowding and Alpha Decay
As Innovation & Tech Today explains, "developing strategies that incorporate the right data and apply the right algorithms is the primary challenge faced by today's retail traders."
The democratization of trading tools has created a paradox: when everyone uses the same technical indicators pointing to the same setups, those setups stop working. The edge disappears.
🎯 Lack of Invalidation Discipline
Most retail traders enter positions without a clear "this is wrong" level. They watch losing trades hoping for reversals instead of accepting that good setups fail—and that a good process with a losing trade is still good process.
Professional technicians always define invalidation before entry. Retail traders rarely do.
⚠️ The AI Adoption Gap
According to Morgan Stanley's February 2026 survey, companies globally that have been using AI for at least one year report double-digit productivity gains. The McKinsey State of AI 2025 report found that 64% of respondents say AI is enabling cost and revenue benefits.
Yet most retail traders still analyze charts manually, spending hours on work that AI can accomplish in seconds.
How Free AI for Technical Stock Analysis Solves These Challenges
Technical Stock Analyst AI addresses each of these pain points by providing context-aware, probability-based technical analysis that mirrors how elite technicians actually think about markets.
| Traditional Approach | Free AI Technical Stock Analysis |
|---|---|
| Check RSI, assume overbought = sell | Identifies regime first, interprets RSI in context |
| Draw support/resistance lines manually | Locates liquidity zones where stops cluster |
| Follow influencer trade alerts blindly | Provides transparent reasoning with source citations |
| Enter trades without stop levels | Every setup includes specific invalidation level |
| Analyze one timeframe in isolation | Multi-timeframe analysis from weekly context to daily setup |
| Spend hours on chart analysis | Get institutional-grade analysis in seconds |
🔍 Market Structure Thinking
Unlike basic pattern recognition, Technical Stock Analyst AI understands that chart patterns are footprints of institutional activity, not magic shapes. It identifies:
- Liquidity zones — Where stops cluster below swing lows and above swing highs
- Liquidity sweeps — Price briefly violates a level to trigger stops, then reverses
- Trapped traders — Failed breakouts that fuel reversals as forced exits accelerate moves
📈 Confluence-Based Signal Strength
The tool doesn't just identify patterns—it rates them:
| Signals Aligned | Assessment |
|---|---|
| 1-2 signals | Weak setup — low confidence, needs more confirmation |
| 3-4 signals | Moderate setup — worth watching, consider smaller position |
| 5+ signals | Strong setup — high confluence, favorable risk/reward |
🎯 Probabilistic Framing
Every analysis includes:
- Regime identification — Trending or ranging? Bullish, bearish, or neutral structure?
- Key levels — Support, resistance, and decision points with context
- Relative strength — Performance vs. market and sector
- Specific levels — Entry consideration, target(s), and invalidation/stop level
- Source citations — Links to where data was retrieved
Step-by-Step: Using Free AI for Technical Stock Analysis
Getting started takes just seconds, and the analytical framework you develop compounds in value over time.
Step 1: Ask Your Question
Simply describe what you want to analyze. Examples:
"What's the technical setup on NVDA?"
"Is AAPL showing any bullish patterns?"
"Analyze the S&P 500 weekly chart structure."
Step 2: Receive Regime Context
Technical Stock Analyst AI first identifies whether the stock is trending or ranging, and whether the structure is bullish, bearish, or neutral. This context determines how all other signals are interpreted.
Step 3: Get Market Structure Analysis
The AI locates key liquidity zones, identifies any recent sweeps or traps, and assesses where institutional footprints appear in the price action.
Step 4: Review Confluence Assessment
You'll see how many technical factors align—trend structure, momentum indicators, volume confirmation, relative strength, and upcoming catalysts—with a clear rating of signal strength.
Step 5: Receive Specific Levels
Every analysis includes concrete numbers: entry consideration zone, target price(s), and the invalidation level where the setup is wrong. Example output:
"NVDA is showing a bullish setup with price holding above the 50-day MA after a liquidity sweep below last week's low that was immediately reclaimed—that's a bear trap, shorts are now trapped. RSI at 63 confirms momentum without being overextended. Key resistance at $193; a break above with volume targets $205 (measured move). Support/invalidation at $180—below that, the setup is wrong. Relative strength vs. QQQ is positive. Multiple signals aligned here."
Step 6: Upload Charts for Visual Analysis (Optional)
For more precise pattern analysis, you can upload a screenshot from TradingView or your broker platform. The AI will analyze visible patterns, annotations, indicator readings, and price structure.
Real-World Applications: Who Benefits Most
📊 Swing Trading Setup Identification
Scenario: You want to evaluate AMD's technical setup before entering a position.
Traditional Approach: Open TradingView, check RSI, MACD, moving averages, draw support/resistance lines, compare to sector, check volume—45+ minutes of analysis.
With Technical Stock Analyst AI: Delivers complete analysis with regime context, confluence rating, and specific levels in under 30 seconds.
Results: Users report saving 5+ hours weekly on chart analysis while getting more consistent, institutionally-informed setups.
💼 Pre-Earnings Technical Assessment
Scenario: You're considering a position in TSLA heading into earnings and want to understand the technical setup.
Traditional Approach: Research earnings date, analyze chart for coiled setups, check implied volatility, assess gap risk—requires multiple platforms and significant time.
With Technical Stock Analyst AI: Identifies whether the stock is coiled (low volatility, narrowing range), notes the earnings catalyst, and explains how gaps on catalysts often define new support/resistance levels.
Results: Traders report better position sizing decisions around binary events by understanding what's technically priced in.
📱 Quick Mobile Analysis
Scenario: You're away from your desk and see SPY dropping—you need to know if it's hitting support.
Traditional Approach: Pull up charting app, switch between timeframes, manually identify levels—cumbersome on mobile.
With Technical Stock Analyst AI: Instantly identifies key support zones, notes volume profile context, and assesses whether the level is likely to hold based on market structure.
Results: Get answers anywhere, anytime—no need to navigate complex charting interfaces.
🔄 Failed Move Identification
Scenario: GOOGL just broke below a key level and immediately reversed—you want to understand what happened.
Traditional Approach: Requires understanding of market structure concepts that most retail traders never learn.
With this AI tool: Identifies whether a liquidity sweep occurred, whether price reclaimed the level, and explains the mechanics of why trapped traders fuel reversals.
Results: Access to institutional-level market structure thinking that identifies highest-probability setups from failed patterns.
🎓 Technical Analysis Education
Scenario: You want to understand why certain patterns work, not just memorize shapes.
Traditional Approach: Read books, watch courses, practice for months—steep learning curve.
With Technical Stock Analyst AI: Every analysis includes educational explanations that build your understanding over time. You learn the "why" behind market structure, not just the "what."
Results: Users report developing genuine technical intuition rather than pattern-matching without understanding.
What Free AI for Technical Stock Analysis Cannot Do
Transparency matters. This AI-powered solution is clear about its limitations:
It cannot:
- Predict stock prices with certainty
- Guarantee profitable trades
- Replace risk management discipline
- Execute trades on your behalf
- Access real-time streaming data
It will:
- Frame all outputs as technical observations and probabilities, not predictions
- Include invalidation levels because good setups fail
- Cite sources for verification
- Explain reasoning transparently
- Build your analytical capabilities over time
The goal is favorable risk/reward with clear reasoning—not false certainty.
Frequently Asked Questions
Is this AI for technical stock analysis really free?
Yes. You can access Technical Stock Analyst AI through Jenova's free tier with daily usage limits. For extended analysis sessions and higher usage, paid plans start at $20/month with significantly increased limits—but the free tier provides substantial access for regular trading analysis.
How is this different from TradingView?
TradingView is a charting platform—you still need to interpret the charts yourself. Technical Stock Analyst AI provides the interpretation, explaining what patterns mean in context, rating signal confluence, and delivering specific levels with reasoning.
Can this AI predict stock prices?
No. The tool frames all outputs as technical observations and probabilities, not predictions. Every setup includes an invalidation level because good setups fail—the goal is favorable risk/reward, not certainty.
Does it work on mobile?
Yes. Technical Stock Analyst AI works across web, iOS, and Android with full feature parity. Get technical analysis anywhere without navigating complex charting interfaces.
Can I upload my own charts for analysis?
Absolutely. Upload a screenshot from TradingView, Finviz, or your broker platform, and the AI will analyze visible patterns, annotations, indicator readings, and price structure.
What markets does it cover?
Primary focus is US equities (NYSE, NASDAQ), but technical principles apply to any liquid market—crypto, forex, international equities—with appropriate caveats about data availability.
Where does the data come from?
The AI cites authoritative sources including financial data providers, earnings transcripts, and market data services. All claims are grounded in verifiable data.
Join the 52,000+ Traders Building Real Technical Skills
The gap between institutional and retail technical analysis has never been smaller. As The TRADE's 2026 predictions note, "routine, repeatable research will increasingly be automated," freeing traders to focus on "deep domain expertise and informed decision-making."
The question is whether you'll leverage AI to develop that expertise—or continue drowning in conflicting signals.
Technical Stock Analyst AI provides the market structure thinking, confluence assessment, and probabilistic framing that separates elite technicians from the crowd—delivered in seconds instead of hours.
Stop guessing what indicators mean. Stop entering trades without invalidation levels. Stop drowning in conflicting signals.
Try Technical Stock Analyst AI and experience institutional-grade technical analysis that actually explains the why behind every signal.
These are technical observations for educational purposes, not investment advice. Always manage risk according to your own plan.