AI TCG Mana Curve Calculator: Land Counts, Draw Odds & Curve Balance
2026-10-23
Trading Card Game Creator gives you a conversational TCG mana curve calculator. It works through land counts, opening-hand odds, and curve balance alongside you. A heatmap or spreadsheet shows probabilities but leaves the interpretation to you. This AI handles both steps: it runs the hypergeometric math and then explains what the numbers mean for your list.
As of October 2026, deckbuilders can choose from many single-purpose calculators. Most answer only one narrow question. Trading Card Game Creator connects the answers into a single deck-building decision.
- ✅ Grounded in hypergeometric probability, the same model behind competitive mana base research
- ✅ Handles 40-card Limited, 60-card Constructed, and 99-card singleton formats
- ✅ Explains why a curve works, not only what the odds are
- ✅ Doubles as a full TCG design studio for creators balancing their own cost systems
Mana curve tools have been around for over a decade. Even so, players still miss land drops, flood out, and argue about whether 23 or 24 lands is correct. The gap is usually interpretation, not math. To see why, start with what a mana curve calculator actually measures and where traditional tools fall short.
Quick Answer: What Is a TCG Mana Curve Calculator?
A TCG mana curve calculator is a probability tool that uses deck size, resource count, and casting costs to estimate how reliably you'll hit land drops and cast spells on curve each turn. AI versions add interpretation and recommendations.
Key capabilities:
- Opening-hand land distribution (for example, the odds of drawing 2–4 lands in seven cards)
- Turn-by-turn odds of hitting your Nth land drop on the play versus on the draw
- Colored source requirements for each spell's mana cost
- Curve-shape analysis: whether your 1-, 2-, 3-, and 4-drops match your land count and strategy
The Problem: Mana Math Is Easy to Compute and Hard to Use
Every Magic: The Gathering player learns the basic constraint early. Standard decks require a 60-card minimum with up to a 15-card sideboard, and lands have to fit inside that budget alongside every threat and answer. The common starting point is the 40% rule:
24 lands in a 60-card deck — the general rule of thumb that roughly 40% of your deck should be lands
Serious analysis quickly moves past rules of thumb. Frank Karsten's widely cited research uses a higher baseline:
25 lands in a 60-card deck, 17 in a 40-card deck, 41 in a 99-card deck — Karsten's baseline land counts in his 2022 mana source analysis
90% for a one-drop, rising to 96% for a seven-drop — the sliding (89 + mana value)% consistency threshold embedded in Karsten's colored-source tables
Turning these benchmarks into a decision for your deck is harder than it looks:
- Calculators answer narrow questions. A heatmap shows land distribution but says nothing about colored pips or whether your curve shape fits.
- Rules of thumb conflict. The 40% rule says 24 lands, Karsten's baseline says 25, and aggro lists run fewer. Which applies to you?
- Mulligans change everything. The London mulligan lets you always choose your starting hand from seven cards, and Karsten's 2022 refresh adjusted his tables for the London mulligan era.
- Trade-offs compound. As one notes, raising land counts can mean more flood mulligans, while keepable hands become more likely to lack a specific color.
The median line hides a lot
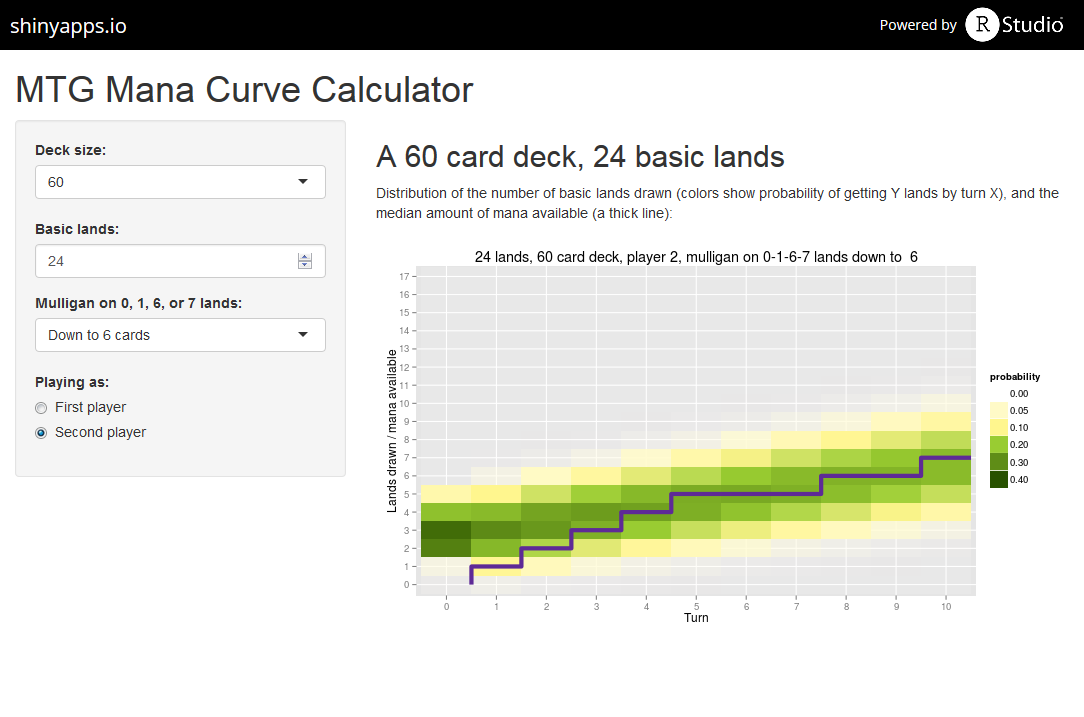
Look at the heatmap above: 24 lands, playing second, mulliganing 0-, 1-, 6-, and 7-land hands down to six. The purple median line climbs one land per turn through turn 4. After that it flattens: it stays at 5 from turn 5 through turn 7, reaches 6 on turns 8–9, and only hits 7 on turn 10.
That flattening matters more than the smooth early slope suggests. Using the hypergeometric formula, a 24-land, 60-card deck with no mulligan has roughly a 63% chance of holding four lands by turn 4 on the play (10 cards seen). On the draw (11 cards seen), that rises to about 73%. Both figures sit well below the 90%+ thresholds competitive players target. The median line looks reliable, yet roughly one in three games on the play stalls short of a fourth land drop.
Spreadsheets bury the insight
Dedicated players have been building their own tools for years. One MTG Salvation spreadsheet from 2009 calculated the probability of drawing x lands in y cards from any deck size and land count. These tools are accurate. However, they return grids of numbers and leave the strategic reading entirely to you.
This is exactly what Trading Card Game Creator was built for.
Why Trading Card Game Creator
Trading Card Game Creator is a complete TCG design studio. It covers mechanics, balance, and set construction, and that same balance expertise makes it a capable mana curve analyst. Rather than returning a single probability, it reasons about your whole resource system: land count, curve shape, colored requirements, and play pattern together.
| Traditional Approach | Trading Card Game Creator |
|---|---|
| One calculator per question (lands, colors, mulligans) | One conversation covering every resource question |
| Raw probability grids you interpret yourself | Plain-language verdicts with the math shown |
| Conflicting rules of thumb (24 vs. 25 lands) | Recommendations tied to your actual curve and archetype |
| Rebuilding spreadsheets for every deck change | Instant what-if comparisons ("cut a land, add a cantrip") |
| Tools built for one game only | Fluent in resource systems across TCGs, including your own designs |
Hypergeometric math, explained
At its core, every mana curve calculator uses the hypergeometric distribution:
Here, N is deck size, K is the number of lands, n is the number of cards seen, and k is the number of lands you want. For a 24-land, 60-card deck, this formula gives the following opening-hand distribution:
| Lands in 7-card opener | Probability |
|---|---|
| 0–1 | ≈ 14.3% |
| 2 | ≈ 26.9% |
| 3 | ≈ 30.9% |
| 4 | ≈ 19.6% |
| 5+ | ≈ 8.3% |
That works out to about 77% of seven-card hands landing in the keepable 2–4 range. Trading Card Game Creator computes figures like these and then tells you what they imply. For example, it might note that a deck with eight one-drops can comfortably keep two-landers, while a deck full of four-drops cannot.
Curve shape, not just land count
Land count follows from your curve, not the other way around. Competitive guidance suggests aggro decks run 22–23 lands, midrange 24–25, and control 25–26. Trading Card Game Creator flags curve problems the calculators miss: a gap at the 2-slot, too many competing 3-drops, or a top end your land count can't support.
Colored sources that match your pips
Total land count is only half the problem. Karsten's tables indicate that a card costing 1WW in a 60-card deck needs about 18 white sources. Share your list, and the AI identifies which spells set your color requirements and where your mana base falls short.
Spreadsheet-grade tables without the spreadsheet
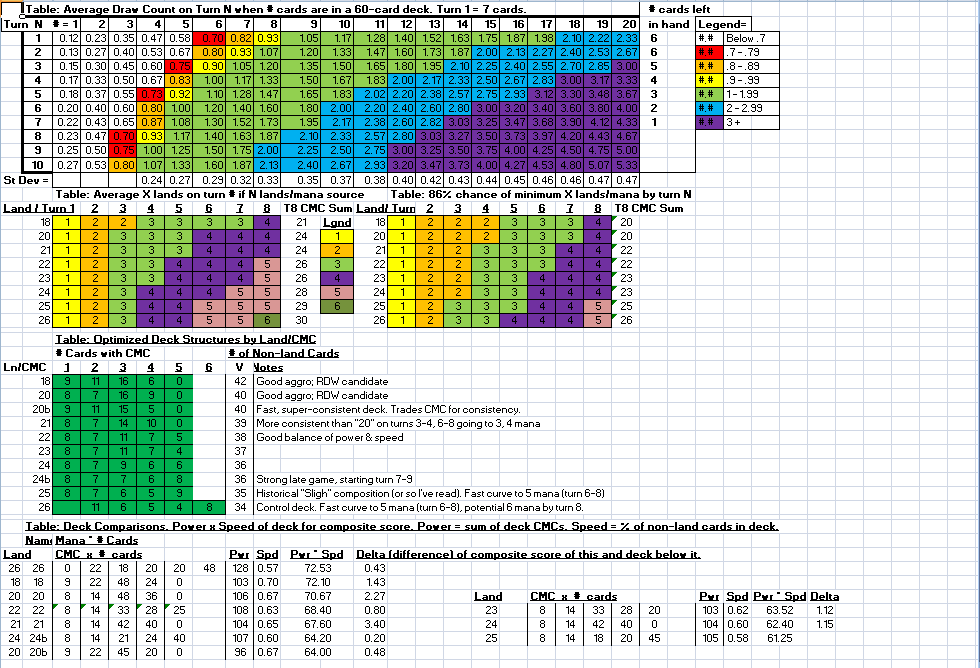
The spreadsheet above shows how far dedicated players push this analysis. It covers average draw counts per turn, a table showing the "86% chance of minimum X lands by turn N," and optimized deck structures labeled by archetype. Examples include "Good aggro; RDW candidate" at 18–20 lands, "Strong late game, starting turn 7–9" at 24 lands, and a control build curving to six mana by turn 8. Trading Card Game Creator can produce this kind of comparative breakdown on request, without the formula maintenance.
Example prompts:
"Here's my 60-card mono-red list with 22 lands. What are my odds of casting a 3-drop on turn 3 on the play, and should I go to 23?"
"Compare a 17-land and a 16-land version of my two-color draft deck with four 5-drops."
"I'm designing my own TCG where players play one resource card per turn. Help me set a cost curve so 4-cost cards come online by turn 4 about 85% of the time."
Related Agents You'll Also Find Useful
If you're also building your own tools or researching the meta, these agents fit naturally into the same workflow.
Excel Generator Prefer to own your calculator? Excel Generator builds professionally structured workbooks with formulas and formatting applied automatically. It's well suited to turning a hypergeometric model into a reusable spreadsheet like the one shown above.
- Formula-driven land probability tables you can tweak per deck
- Clean sheet architecture across multiple decks or formats
- Conditional formatting for heatmap-style readouts
Game Designer Assistant For creators building an original card game, Game Designer Assistant extends the analysis into full systems design.
- Systems analysis for resource economies and pacing
- Design documentation for rules and card templates
- Brainstorming across genres and platforms
Deep Research When you want the latest published thinking on land counts, archetype data, or mulligan studies, Deep Research searches widely and returns cited reports.
- Synthesizes findings across many sources with inline citations
- Useful for comparing competing land-count methodologies
- Delivers actionable summaries rather than link dumps
Try Trading Card Game Creator free — no credit card required.
How to Use an AI Mana Curve Calculator
Step 1: Share your deck list or curve Paste your full list, or just the count of cards at each mana value plus your land total. Include color requirements if you're playing more than one color.
"Curve: 8 one-drops, 12 two-drops, 8 three-drops, 4 four-drops. 22 lands, red-white, 60 cards."
Step 2: Set the format and play pattern Specify the deck size, whether you expect to be on the play or the draw, and your mulligan habits. These change the numbers meaningfully: as calculated above, the 4th-land odds shift by about ten percentage points between play and draw.
"Assume best-of-three Standard, mostly on the play, and I mulligan any hand with 0, 1, 6, or 7 lands."
Step 3: Ask for the probability breakdown Request the specific odds that matter for your strategy. Trading Card Game Creator returns the figures with the reasoning behind them.
"What's my chance of having a land on turn 1, two lands by turn 2, and a white source for my 1W two-drops?"
Step 4: Stress-test changes Run what-if comparisons before you commit. Swapping a land for a cheap card-filtering spell, or a 4-drop for a 2-drop, often matters more than the raw land count.
"Compare 22 lands versus 21 lands plus one cantrip. Which gives better turn-3 consistency without flooding?"
Step 5: Lock in and document Ask for a final summary: land count, color split, and a short list of curve adjustments. Save it as notes, or hand it off to a spreadsheet for future tuning.
Results & Use Cases
📊 Tuning a 60-Card Aggro List
Scenario: A player running a low-curve red deck wants to know whether 21, 22, or 23 lands is correct for a curve topping out at three.
Traditional Approach: Run the same numbers through a land calculator three times, then cross-reference a colored-source table, then guess at the flood risk.
Trading Card Game Creator: One conversation compares all three counts against the actual curve, flags the flood rate at 23, and recommends a count matched to the deck's one- and two-drop density.
- Side-by-side odds for each land count
- Curve-aware recommendation instead of a generic rule
- Explicit trade-off between screw and flood
💼 Balancing the Cost Curve for an Original TCG
Scenario: An indie designer wants a resource system where mid-cost cards arrive on time without making early turns feel empty.
Traditional Approach: Build a custom simulation or spreadsheet, playtest for weeks, then rebuild the model whenever the resource rules change.
Trading Card Game Creator: The AI models resource draw odds for proposed deck sizes and resource counts, then suggests cost distributions for each rarity tier. Game Designer Assistant can extend this into broader systems documentation.
- Probability targets defined before playtesting begins
- Faster iteration on resource rules
- Balance reasoning tied directly to card costs
📱 Checking Land Count Between Rounds
Scenario: At a local store event, a player wants to know whether siding out a land for an extra removal spell will hurt their curve in game two.
Traditional Approach: Hunt for a mobile-friendly calculator, enter numbers on a tiny screen, and still guess how to read the result.
Trading Card Game Creator: A quick voice or text question on a phone returns the updated odds and a clear yes-or-no recommendation before the next round starts.
- Fast answers with full mobile functionality
- Context-aware sideboarding advice
- No spreadsheets or formula entry
🎯 Setting a Commander Land Count with Ramp
Scenario: A Commander player with a 3.0 average mana value and ten ramp pieces wants a land count grounded in data.
Traditional Approach: Rely on community folklore, which suggests many casual Commander decks land around 36–38 lands.
Trading Card Game Creator: The AI applies Karsten's published 99-card regression (lands = 31.42 + 3.13 × average mana value − 0.28 × ramp pieces). That gives 31.42 + 9.39 − 2.80 ≈ 38 lands, which it then adjusts for draw engines and color count.
- Data-backed starting point instead of guesswork
- Clear explanation of how ramp offsets land count
- Adjustments for specific deck features
Frequently Asked Questions
What is the best TCG mana curve calculator?
The best calculator depends on your question. Heatmap tools visualize land distribution by turn, colored-source calculators apply Karsten's tables, and spreadsheets offer full control. An AI tool like Trading Card Game Creator combines these functions conversationally. It calculates hypergeometric odds and interprets them against your curve, which helps when you need a decision rather than another probability table.
How many lands should a 60-card deck run?
Most competitive 60-card decks play 22–26 lands. The 40% rule suggests 24, while Karsten's baseline analysis uses 25. Aggro decks with many one- and two-drops typically run 22–23, midrange decks 24–25, and control decks 25–26. Your exact count should follow your curve: lower average mana values support fewer lands, and heavy top ends need more.
Can Trading Card Game Creator analyze my mana curve?
Yes. Trading Card Game Creator works through land counts, opening-hand odds, turn-by-turn land drop probabilities, and colored source needs from your deck list or curve breakdown. It also explains the strategic implications. For highly specific mulligan simulations across thousands of games, a dedicated Monte Carlo tool remains a useful cross-check.
Does the London mulligan change mana curve math?
Yes. The London mulligan lets you draw seven cards and bottom one for each mulligan, so you choose from a full seven-card selection every time. That makes mulligans less punishing and slightly changes optimal land counts. Karsten's 2022 analysis updated his tables specifically for the London mulligan, so newer calculators reflect this rule while older spreadsheets may not.
Can I build my own mana curve calculator spreadsheet?
Yes. The hypergeometric function is available in Excel and Google Sheets, so you can model land odds for any deck size. If you'd rather skip the formula work, Excel Generator builds structured workbooks with formulas and formatting applied automatically. That gives you a reusable calculator you can adjust for every new deck.
Is Trading Card Game Creator free to use?
Trading Card Game Creator is available on a free tier with all core features and limited usage. Paid plans start at $20 per month for 30× usage and custom model selection, with higher tiers for heavier use. It works on web, iOS, and Android with full feature parity, so you can check curve math from your phone at events.
Conclusion
A TCG mana curve calculator is only as useful as your ability to act on its output. Heatmaps reveal that median land counts flatten after turn 4. Spreadsheets show that a 24-land deck misses its fourth land drop on the play in roughly one of every three games. Neither tool tells you what to change.
An AI mana curve calculator closes that gap. It connects land counts, curve shape, colored sources, and mulligan behavior into a recommendation you can apply to your next build. Whether you're tuning an aggro list, setting a Commander land count, or designing the resource system for your own card game, the math becomes a decision instead of a puzzle.
Try Trading Card Game Creator now. Explore more at Jenova.
For Developers: Trading Card Game Creator is available programmatically via the Jenova API — integrate TCG balance and mana curve analysis into your deck-building app with a single API call. Full documentation →