AI SEC Filing Analyzer: Extract Financial Data From 10-Ks in Minutes
2026-08-18
An AI SEC filing analyzer reads 10-Ks, 10-Qs, 8-Ks, and S-1 registration statements the way an experienced equity analyst does — locating the disclosure that matters, extracting the numbers, and citing the exact source passage. Instead of scrolling through a 300-page annual report hunting for a segment table, you ask a question and get a sourced answer. The Fundamental Stock Analyst on Jenova does exactly this, combining filing-level research with real-time market data.
✅ Pull specific tables, segment data, and risk factors from filings without manual scrolling ✅ Compare disclosures across multiple companies and multiple reporting periods ✅ Every extracted figure traces back to the original filing language ✅ Works across 10-K, 10-Q, 8-K, S-1, proxy statements, and insider Forms 3/4/5
To understand why this matters, it helps to look at the sheer scale of the disclosure system analysts are working against — and why traditional keyword search on EDGAR breaks down precisely when the question gets interesting.
Quick Answer: What Is an AI SEC Filing Analyzer?
An AI SEC filing analyzer is a research tool that reads SEC disclosure documents, extracts specific financial data and narrative disclosures, and answers analyst questions with citations back to the source filing. It replaces manual keyword search and page-by-page reading with direct question-and-answer retrieval.
Key capabilities:
- Targeted extraction — pull a specific table, segment breakdown, or footnote from a filing without reading the full document
- Cross-filing comparison — line up the same disclosure across competitors or across multiple fiscal years
- Narrative analysis — surface changes in risk factor language, MD&A tone, and accounting policy footnotes
- Source-grounded output — each figure and claim references the filing section it came from, so the work is auditable
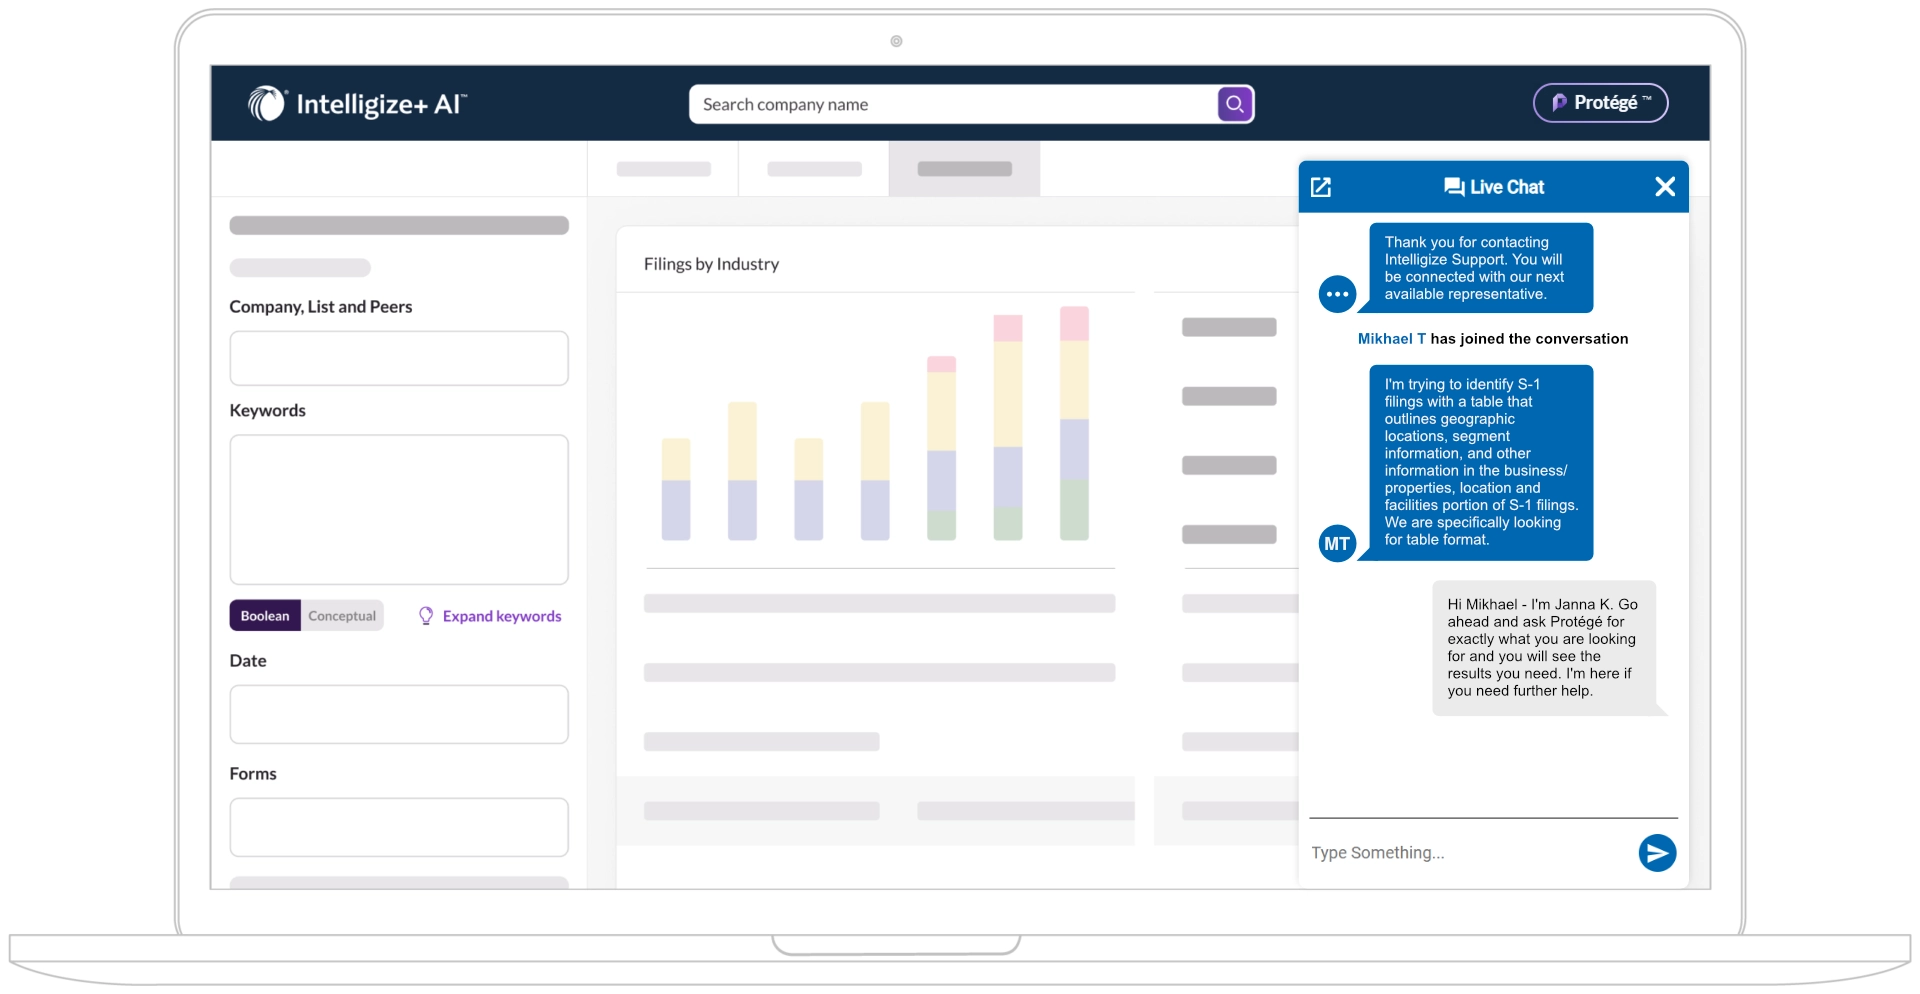
The Problem: SEC Filings Are Public, But Not Actually Accessible
Every public company disclosure is free. EDGAR has been online since 1993, and the SEC now publishes filing counts by form type for every calendar year since then. The data is not hidden. The problem is volume and structure.
2,000 to 11,000 filings published per day — SEC EDGAR filing volume statistics
60 to 90 days — the window in which companies must submit the annual Form 10-K after fiscal year close, per SEC requirements
But turning that raw disclosure into an answer is frustratingly difficult:
- Keyword search returns hundreds of hits with no ranking by analytical relevance
- The information you need is often in a table, not in searchable prose
- Comparing the same disclosure across five companies means opening five documents
- Critical detail lives in footnotes, not headline financials
- Language changes year-over-year in ways only a careful reader catches
Keyword Search Doesn't Understand Intent
Searching EDGAR full-text for "geographic segment" returns every filing containing that phrase. It does not tell you which filings present the data as a structured table, which ones break out revenue by country versus region, or which ones changed their segmentation methodology between periods. Analysts end up opening dozens of documents to find the handful that actually match the question.
The Signal Is in the Footnotes
Investopedia's guide to SEC forms is direct about this: footnotes reveal which accounting method a company uses, errors in previous statements, looming legal cases, and details of synthetic leases. That is exactly the material most likely to be skipped under time pressure — and exactly where accounting red flags surface.
Structured Data Only Covers Part of the Picture
The SEC does publish machine-readable financial data. Its XBRL APIs deliver JSON-formatted facts from 10-Q, 10-K, 20-F, 40-F, and 6-K filings, updated in real time. But XBRL covers tagged financial statement facts. It does not cover risk factor narrative, MD&A commentary, properties and facilities descriptions, or the qualitative disclosures that shape an investment thesis. For those, someone still has to read.
Cross-Company Work Multiplies Everything
Relative valuation requires the same disclosure pulled consistently across a peer set. Five companies across three fiscal years means fifteen documents, each with its own structure and terminology. Manual extraction at that scale is where research timelines break.
The Broader Market Is Moving Toward Automation
The pressure is not theoretical. LSEG's analysis of financial analytics trends notes that firms are investing heavily in AI to reduce operational costs and analyze large volumes of data, with the shift toward intraday, real-time analysis making end-of-day manual workflows increasingly untenable. Market research puts the AI in financial planning and analysis market on a 26.9% CAGR through 2029.
This is exactly what an AI SEC filing analyzer was built for.
Why the Fundamental Stock Analyst Works for Filing Research
The Fundamental Stock Analyst approaches filings the way a sell-side analyst does: it starts from the question, finds the disclosure that answers it, and shows the source. It combines SEC filing research with real-time market data, analyst estimates, and sentiment — so filing analysis lands in market context rather than in isolation.
| Traditional Filing Research | Fundamental Stock Analyst |
|---|---|
| Full-text keyword search returning hundreds of unranked hits | Question-driven retrieval targeting the specific disclosure |
| Manually scrolling a 300-page 10-K for one table | Direct extraction of the table, segment, or footnote you named |
| Opening five documents to compare one metric across peers | Single request returns a side-by-side comparison |
| Numbers copied into a spreadsheet, source link lost | Every figure traceable to its filing section |
| Financial statements analyzed separately from market context | Filing data synthesized with estimates and market sentiment |
Targeted Table and Section Extraction
Ask for a specific structure and you get that structure. The properties and facilities section of an S-1, the geographic revenue table from a 10-K, the segment reconciliation footnote — extraction is scoped to what you asked for rather than dumping the whole document.
"Pull the geographic revenue breakdown table from the most recent 10-K for the three largest US semiconductor companies and show them side by side."
Year-Over-Year Narrative Comparison
Risk factors and MD&A language shift subtly. A newly added supply chain paragraph or a quietly removed customer concentration warning carries information. The analyst compares narrative sections across periods and flags what changed.
"Compare the risk factors section of this company's last three 10-K filings and identify what was added, removed, or materially reworded."
Footnote and Accounting Policy Review
Because footnotes carry the accounting method disclosures and contingency detail, they get first-class treatment rather than being skipped.
"Review the accounting policy footnotes in this 10-K and flag anything that deviates from standard industry treatment."
Cross-Filing and Cross-Company Synthesis
Peer set analysis works in a single pass. Name the companies, name the metric, and the comparison comes back structured — with each figure attributable to the filing it came from.
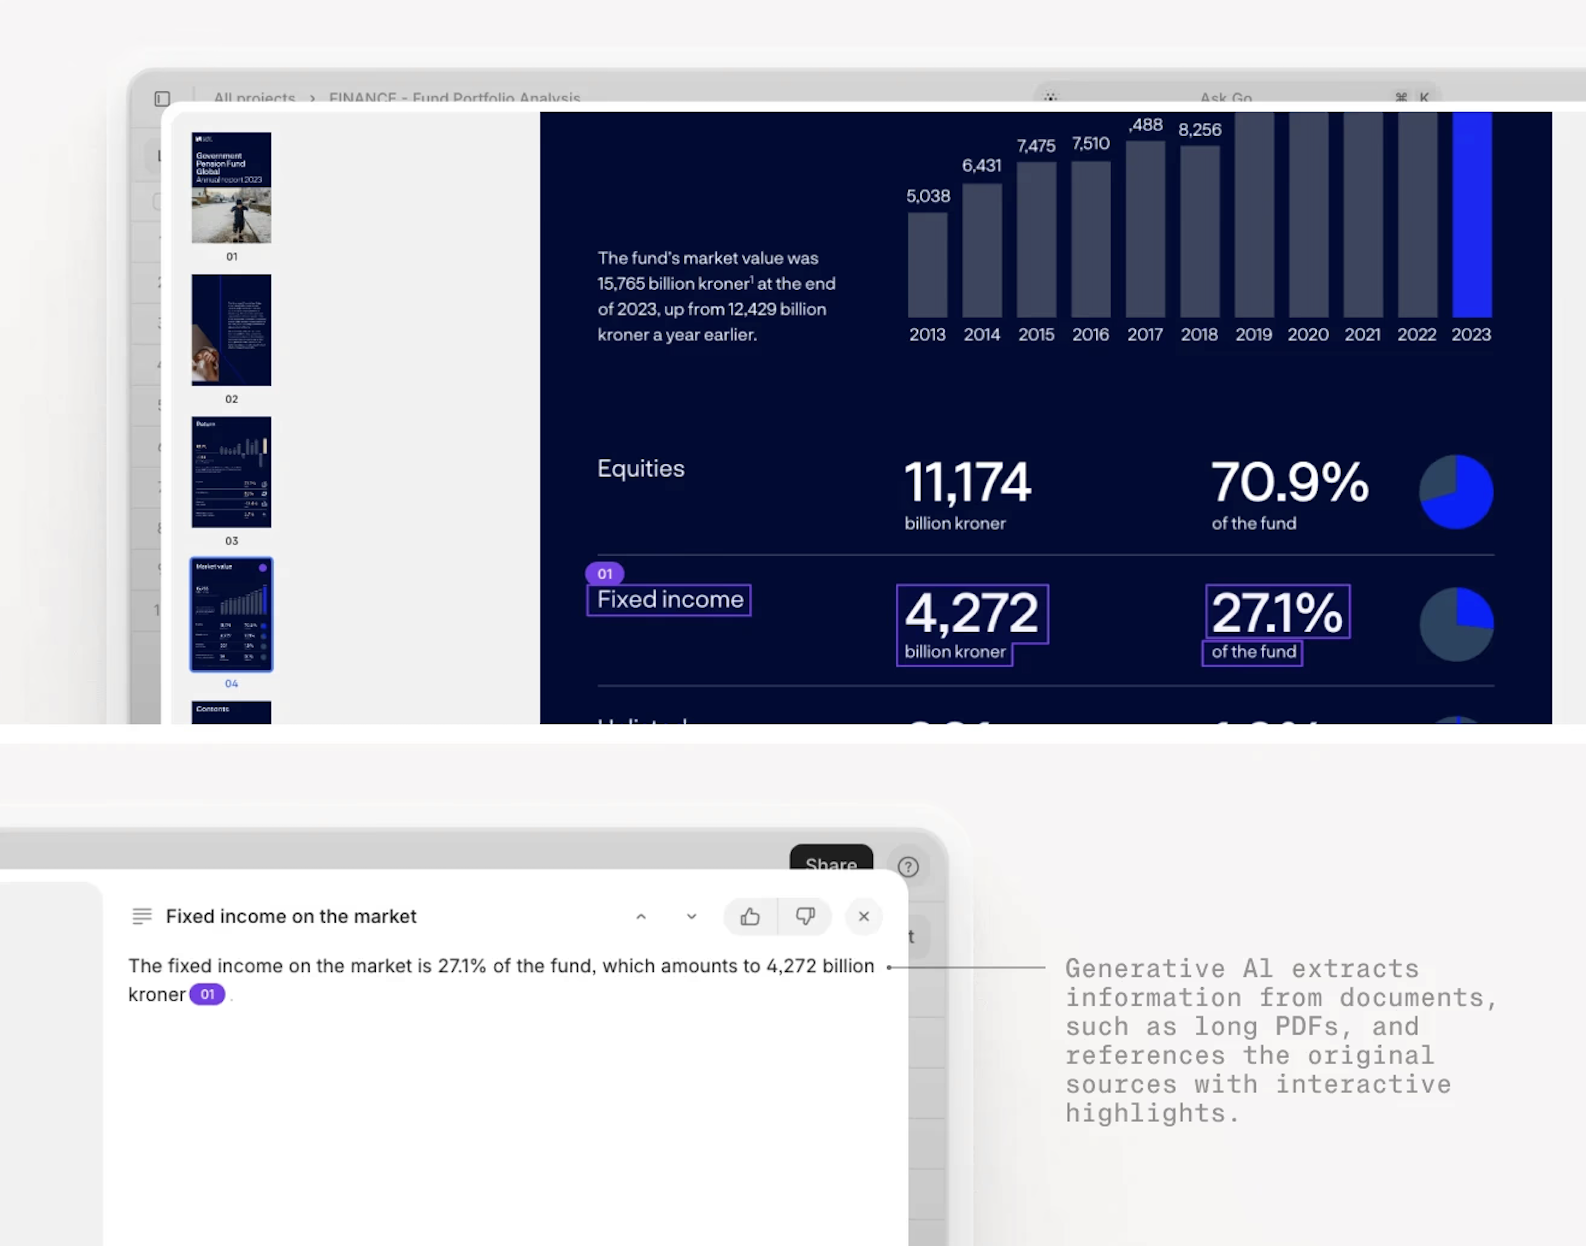
The pattern above generalizes: AI extracts a specific figure from a long document, then links the answer back to the exact page and passage it came from. That traceability is what separates usable filing analysis from a plausible-sounding summary.
Related Agents You'll Also Find Useful
Filing analysis rarely stands alone. These agents cover the adjacent work that follows a 10-K read.
Technical Stock Analyst
Once fundamental research establishes a view, entry and exit still need timing. The technical analyst reads price action and market structure to identify setups with defined risk.
- Chart, volume, and momentum analysis grounded in market structure
- High-probability setup identification with explicit risk levels
- Complements filing-based conviction with execution-level timing
Accounting & Audit Assistant
When a footnote raises a question about revenue recognition or lease treatment, this agent handles the standards-level interpretation.
- Financial statement analysis and journal entry review
- Accounting standards guidance and risk assessment
- Audit planning support for deeper diligence work
Options Strategist
If your filing research produces a directional view around an earnings event or a catalyst disclosed in an 8-K, this agent translates that view into an appropriate structure.
- Strategy selection matched to your thesis and time horizon
- Volatility analysis, Greeks, and position sizing
- Trade management across experience levels
Economics Analyst
Company disclosures do not exist in a vacuum. Macro conditions shape how a filing should be read.
- Macro, trade, and policy analysis with mechanism tracing
- Scenario analysis for rate, inflation, and demand assumptions
- Data-driven context for sector-level conclusions
Try the Fundamental Stock Analyst free — no credit card required.
How an AI SEC Filing Analyzer Works
Step 1: Name the company and the filing
Start with the specific document. Company name, form type, and period — or just the company and the most recent filing of a given type.
"Analyze the most recent 10-K for this company, focusing on the business segment disclosures."
Step 2: Ask for the specific disclosure you need
Precision in the question produces precision in the answer. Name the table, section, or metric rather than asking for a general summary.
"Extract the properties and facilities section and present the geographic locations in a table with square footage and function."
Step 3: Expand into comparison or trend analysis
With the base extraction complete, widen the scope — across peers, across periods, or both.
"Now pull the same table from the two closest competitors and highlight where their facility footprints overlap."
Step 4: Verify against the source
Every figure references its origin in the filing. Check the numbers that drive your conclusion before they go into a model or a memo.
"Show me the exact filing language behind the segment revenue figures you just extracted."
Step 5: Carry it into your deliverable
Move from extraction to output — a valuation build, a comparison memo, or a thesis writeup — with the sourced data already in hand.
"Build a relative valuation comparison using the revenue and margin data extracted from these three filings."
Results & Use Cases
📊 Peer Set Segment Comparison
Scenario: An analyst covering enterprise software needs revenue by geography for six companies across the two most recent fiscal years.
Traditional Approach: Twelve 10-K documents opened, geographic tables located manually, figures transcribed into a spreadsheet with transcription risk at every step. Half a day minimum.
Fundamental Stock Analyst: One structured request returns the full matrix with each figure traceable to its source filing.
- Consistent extraction methodology across all six companies
- Segmentation methodology differences surfaced rather than silently averaged
- Output structured for direct import into a valuation model
💼 Pre-IPO S-1 Diligence
Scenario: An investor evaluating a pending IPO needs the business, properties, and facilities disclosures from the S-1, specifically in table format.
Traditional Approach: Full-text search across S-1 filings, then manual review of each result to determine which present the data as structured tables versus narrative prose.
Fundamental Stock Analyst: Locates the relevant sections and returns table-formatted output, with narrative context preserved where the filing presents it that way.
- Registration statement structure understood, not treated as generic text
- Prospectus risk language and forward-looking statement caveats flagged
- Cross-referenced against comparable recent S-1 filings in the same sector
📱 Mobile 8-K Response
Scenario: A material 8-K drops mid-market. You are away from your desk and need to know whether it changes the thesis.
Traditional Approach: Wait for desk access, or squint through a raw filing on a phone browser with no analytical context.
Fundamental Stock Analyst on mobile: Ask for the material change, the disclosure context, and how it compares to prior 8-K events from the same issuer.
- Full feature parity across web, iOS, and Android
- Real-time market data layered onto the filing disclosure
- Conversation continues from your desktop session without repeating context
🎯 Footnote Red Flag Screening
Scenario: A position is under review and the accounting looks aggressive, but nothing in the headline financials is obviously wrong.
Traditional Approach: Line-by-line footnote reading across multiple filing years, requiring accounting expertise most generalists do not have on hand.
Fundamental Stock Analyst: Reviews accounting policy footnotes across periods and flags method changes, unusual treatments, and disclosure gaps for follow-up with the Accounting & Audit Assistant.
- Method changes between reporting periods surfaced explicitly
- One-time and special charges identified across the filing history
- Findings routed into standards-level review where warranted
FAQ
Is an AI SEC filing analyzer free to use?
The Fundamental Stock Analyst is available on Jenova's free tier with all core features and limited monthly usage. Paid tiers start at $20/month and scale usage substantially, along with custom model selection. Usage resets monthly on your billing date with no daily caps, so the full allowance is available from day one.
Can it read every SEC form type?
It handles the disclosure documents analysts actually work with: Form 10-K annual reports, 10-Q quarterly reports, 8-K material event disclosures, S-1 registration statements, proxy statements, and insider Forms 3, 4, and 5. Registration statements and periodic reports have different structures, and the analysis accounts for those differences rather than treating all filings as generic documents.
How is this different from EDGAR full-text search?
EDGAR search matches strings. It returns every filing containing your keyword with no ranking by analytical relevance and no ability to extract a specific table. An AI SEC filing analyzer works from the question — locating the relevant disclosure, extracting the requested structure, and comparing it across companies or periods in a single pass.
Are the extracted numbers reliable enough for a model?
Every figure traces back to the filing section it came from, so you can verify before it enters a model. That said, treat AI extraction as a research accelerator, not a substitute for review of material figures. The SEC itself notes that investors should review full Commission filings before making investment decisions.
Can it compare filings across multiple companies at once?
Yes. Cross-company comparison is one of the strongest use cases, because manual peer set extraction is where research timelines break down. Name the companies and the disclosure, and the comparison returns structured with per-company attribution.
Does it work on mobile?
Full feature parity across web, iOS, and Android, with settings and conversation history synced across devices. Filing analysis started on desktop continues on mobile without re-establishing context.
Conclusion
SEC filings have never been more accessible or less usable. Thousands of documents publish daily, the structured XBRL layer covers only tagged financial facts, and the disclosures that actually move an investment thesis — segment tables, risk factor language, accounting footnotes — still require someone to read the document. That gap between availability and usability is where research hours disappear.
An AI SEC filing analyzer closes it. Ask for a specific table and get that table. Compare risk factors across three years and get the diff. Pull the same metric across a six-company peer set and get a structured matrix with every figure sourced. Filing research shifts from document hunting to question answering, with the audit trail intact.
Try the Fundamental Stock Analyst now — pair it with the Technical Stock Analyst for entry timing and the Accounting & Audit Assistant for standards-level review. Explore more at Jenova.
For Developers: The Fundamental Stock Analyst is available programmatically via the Jenova API — integrate SEC filing extraction and equity research into your fintech application with a single API call. Full documentation →