AI Portfolio Strategist: Allocation, Drift & Risk Analysis
2026-08-27
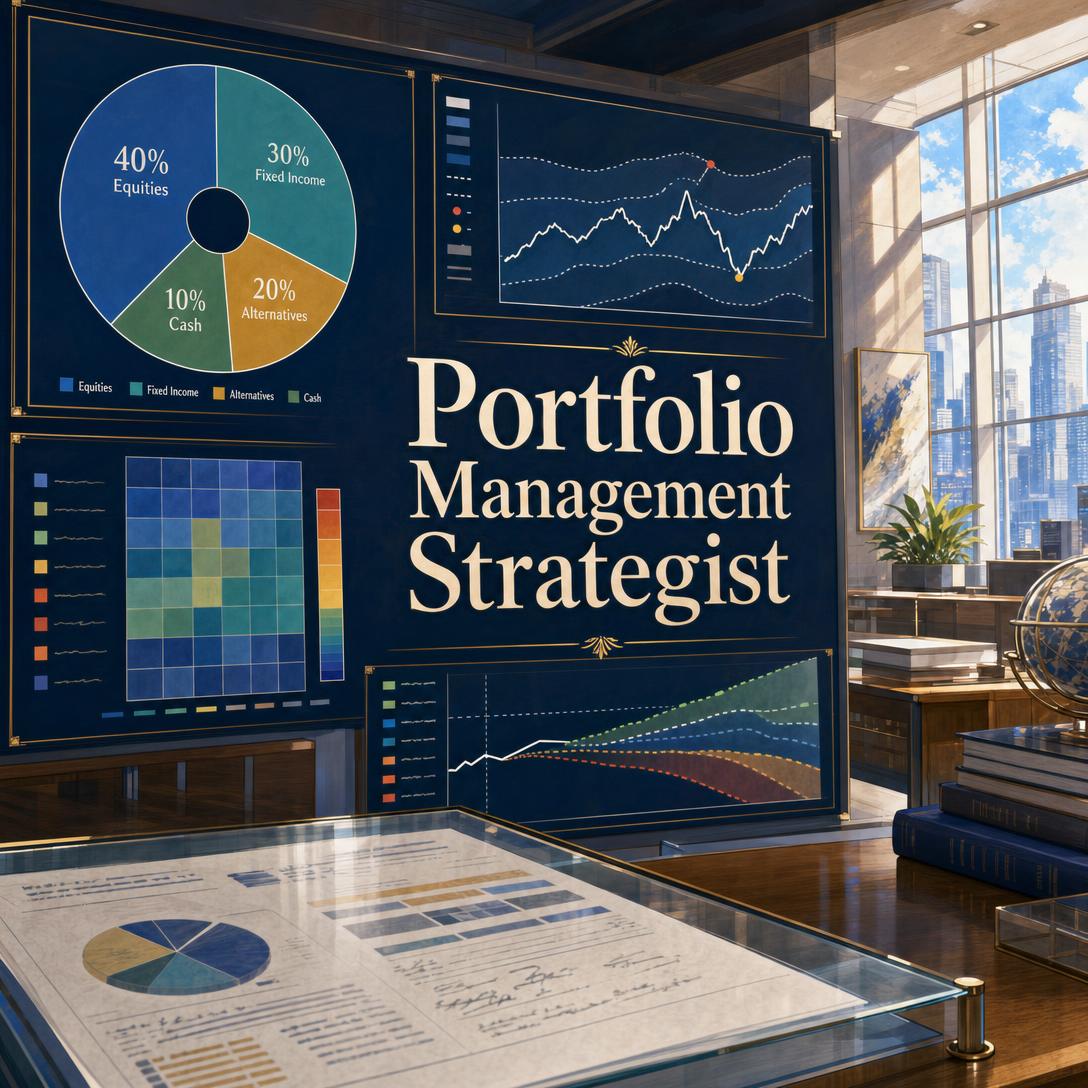
Portfolio Management Strategist helps professional investors analyze allocations, detect drift, and flag concentration risk by turning holdings data into clear, decision-ready portfolio intelligence. While most investors notice hidden concentration only after a drawdown, this AI reviews asset-class, sector, and factor exposures, then produces rebalancing trade lists before losses compound.
- ✅ Allocation analysis across asset class, sector, geography, and factor
- ✅ Concentration and correlation-cluster flags with explicit thresholds
- ✅ Drift quantification with specific rebalancing trade suggestions
- ✅ Regime-aware risk assessment and exportable portfolio reports
To understand why this matters, it helps to look at how portfolios actually break — not in theory, but in the way real holdings drift, cluster, and concentrate under market stress.
Quick Answer: What Is Portfolio Management Strategist?
Portfolio Management Strategist is an institutional portfolio analyst that reviews allocations, flags concentration and drift, and produces rebalancing insights without executing trades. It is built for investors who need a dedicated analyst's workflow, not a brokerage ticket.
Key capabilities:
- Allocation breakdowns by asset class, sector, geography, and factor
- Concentration scoring against single-position, sector, and correlation thresholds
- Current-versus-target drift analysis with suggested trades
- Qualitative risk assessment across rate, equity, currency, and sector shocks
- Tax-aware notes on loss harvesting and wash-sale considerations
The Problem: Portfolios Drift Faster Than Most Investors Notice
A diversified book is harder to maintain than the familiar advice to avoid putting all eggs in one basket. FINRA notes that concentration risk — amplified losses from a large holding, asset class, or market segment — often arrives through performance itself: a winner grows until it dominates the book. Company stock, overlapping funds, and highly correlated names in the same industry or region create the same problem without a single oversized ticker.
Every six to 12 months — the rebalancing cadence many investment professionals recommend
That calendar is a starting point, not a complete risk process. Between reviews, equities can quietly crowd out bonds, one sector can absorb the risk budget, and three “different” growth names can behave as one position. Moody's describes concentration as the impact of common risk factors that can produce substantial losses across a segment of a portfolio — the same mechanism that turns a tidy equity sleeve into a single-factor bet.
The 2025 tape made the cost of thin diversification unusually visible. After early-April tariff shocks, U.S. equities posted two of their largest one-day losses since the global financial crisis. Bonds did not move in lockstep:
About half the loss — a basic 60/40 portfolio lost roughly half as much as an equity-only book year-to-date through April 15, 2025
Morningstar’s broader 11-asset-class mix — spanning Treasuries, global bonds, gold, commodities, and REITs — held up better still, finishing slightly positive over the same window. That is the practical case for watching correlations, not just position count. BlackRock’s 2025 investment directions likewise frame diversification as something investors must actively rethink, not a static 60/40 habit.
But accessing this discipline is frustratingly difficult:
- Spreadsheets go stale the moment prices move, and few investors rebuild sector, factor, and geography maps after every session.
- Fund overlap is easy to miss: a technology stock, a sector ETF, and a broad index fund can stack the same names.
- Rebalancing is postponed because tax lots, wash-sale windows, and “which side do I trim?” are tedious under time pressure.
- Institutional analytics (VaR engines, optimizer suites, full Brinson attribution) are expensive and overbuilt for many books, while retail apps stop at balances and pie charts.
U.S. Bank outlines familiar remedies — gradual liquidation, hedges, broader diversification — but each still requires a clear picture of where the book is concentrated. Without that picture, investors rebalance the wrong risk.
This is exactly what Portfolio Management Strategist was built for.
Why Portfolio Management Strategist
Portfolio Management Strategist functions as a dedicated portfolio analyst: it ingests holdings, maps each position to a role, scores concentration, and turns drift into a trade list. It analyzes, recommends, and identifies. It does not execute trades, connect to a broker, or manage live positions — which keeps the output in the realm of intelligence you can take to your existing workflow.
| Traditional Approach | Portfolio Management Strategist |
|---|---|
| Static spreadsheets that lag the market | Allocation views by asset class, sector, geography, and factor |
| Concentration found after a drawdown | Threshold flags for single names, top-five weight, sectors, geographies, and correlation clusters |
| Calendar rebalancing that ignores how far weights have moved | Drift in percentage points, ranked by size, with estimated trade values |
| Overlapping funds treated as “diversified” because the ticker count is high | Role-based review: return driver, diversifier, hedge, or income source |
| Full quant platforms for every health check | Fast qualitative risk reads, with a clear line on when a dedicated analytics engine is still required |
Allocation that tracks roles, not just weights
Every holding should earn its place. The analyst scores the book across asset class, sector, geography, and factor, then asks whether each line is doing a job — growth engine, ballast, hedge, or income. A 50-name portfolio of highly correlated stocks is not more diversified than 15 uncorrelated ones. That is the difference between position count and true diversification.
"Strategy is long-only equity with a growth tilt, benchmark S&P 500. Max single name 10%, single sector 30%. Here is the holdings CSV."
Concentration thresholds that surface hidden risk
Default flags (customizable) catch the patterns MathWorks groups under concentration risk — losses when an individual exposure or a related group moves together:
- Single position above 10%
- Top five positions above 40%
- Single sector above 30%
- Single geography above 70% (ex-home country)
- Three or more names likely highly correlated
- Single asset class above 80%
A sector fund will breach sector limits by design; the point is to make the exception explicit rather than accidental.
Drift analysis with a usable trade list
Investopedia treats rebalancing as protection and discipline at both retail and professional levels. The analyst compares current versus target weights, ranks absolute drift, and proposes trims and adds with estimated dollar amounts. If cost basis is available, tax implications ride along with the trade list — including loss-harvest candidates and wash-sale awareness.
"Show current versus target weights, quantify drift in percentage points, and list rebalancing trades largest drift first."
Risk that is multi-dimensional
Volatility is one lens. Concentration, correlation, liquidity, and tail exposure are others. Before allocation changes, the analyst situates the book in a risk regime — risk-on, risk-off, rising rates, stagflation, or volatility compression — because “overweight equities” means different things in each. Directional impact is stated in plain arithmetic (for example, equity weight at a 20% drawdown) rather than as a false-precision stress-test number.
McKinsey notes that technology and AI are reshaping how finance teams run risk operating models. FIS similarly tracks AI-driven tools as part of 2025 risk-management practice. The useful version of that shift, for a working portfolio, is faster identification of which exposures will hurt — not a black-box forecast of returns.
When you also need a cross-asset read on policy, rates, and regime before you rebalance, Macro Strategist can supply that market context so allocation changes are made against current conditions rather than last quarter’s narrative.
How It Works
Step 1: Declare the strategy and load holdings
Start by stating the mandate — long-only equity, multi-asset, income, risk parity, long/short — plus risk limits and a benchmark if you use one. Upload a CSV, paste a table, or describe positions. Required fields are ticker, asset class, quantity, current weight, and current value; sector, currency, target weight, and cost basis unlock deeper P&L, tax, and drift work.
"Ticker, asset class, sector, quantity, target weight, current weight, cost basis, current value — 22 names, base currency USD, quarterly rebalance if drift exceeds 2%."
Step 2: Read the health check
The portfolio analyst returns total value, holding count, allocation mix, and top concentrations, then flags anything that breaches your limits. This is the “look under the hood” step FINRA recommends for funds and ETFs: overlap and correlated clusters show up even when the ticker list looks diversified.
"Run a health check against my thresholds and list every concentration and correlation-cluster flag."
Step 3: Quantify drift and review the trade list
Compare current weights to targets. Trades are sorted by absolute drift, with estimated share counts and dollar values. Tax notes appear when cost basis exists. You still place the orders at your broker; the output is an execution-ready list, not an order ticket.
"Trim names above target, add laggards back to policy weights, and flag any trade with a short-term gain."
Step 4: Stress the book qualitatively
Ask what a rate shock, equity drawdown, or sector rotation does to this allocation. The answer names the positions and sleeves most exposed and uses simple arithmetic for magnitude. Formal multi-factor stress tests and Monte Carlo still belong on dedicated analytics platforms — the analyst is explicit about that boundary.
"If equities drop 20% and my tech sleeve is 32%, what is the approximate impact before correlation effects, and which five names dominate that risk?"
Step 5: Generate the portfolio report
Request a full report: summary metrics, allocation tables, top positions, drift, and risk flags. Use it for an investment-committee pack, a personal quarterly review, or an archive. PDF export is available when you want a file; the in-chat version carries the same substance.
Try this portfolio analyst free — no credit card required.
Results & Use Cases
📊 Post-rally concentration after a narrow leadership tape
Scenario: A long-only growth book rode a handful of mega-cap winners. Three technology names now sit at 11%, 9%, and 8%; the sector is 38% of the portfolio. Targets were 8% / 7% / 6.5% and 30% sector max.
Traditional Approach: A year-end spreadsheet, or a gut feel that “the winners should run.” Investor.gov walks through the classic 80/20 that becomes 85/15 — the same mechanics, scaled to a professional book.
Portfolio Management Strategist: Flags single-name and sector breaches, measures drift in percentage points, and produces a ranked trim list with estimated trade values and tax notes.
- Makes “let it ride” a documented exception rather than an accident
- Separates momentum (informative drift) from policy breach
- Keeps the risk budget aligned with the stated mandate
If a trim candidate still looks cheap on fundamentals and you want a second lens before you cut, Fundamental Stock Analyst can review earnings quality, valuation, and business-model durability so the rebalance is not purely mechanical.
💼 Multi-asset rebalance after a risk-off week
Scenario: A 60/40-style book with a 10% real-asset sleeve. Equities sold off; gold and Treasuries rallied. Policy weights are now off by 3–5 points. The investor must decide whether to rebalance into weakness or wait for a calendar date.
Traditional Approach: Manual weight rebuilds, a debate over “this time is different,” and delayed trades because the work is slow. Oliver Wyman’s 2025 asset-management work describes clients demanding more holistic solutions as public and private assets continue to mix — which only raises the cost of not knowing current weights.
This AI portfolio analyst: Restates current versus target, tags the regime (risk-off: correlations rise, diversification helps less), and lists adds to underweight risk assets and trims to overweight ballast.
- Connects the trade list to regime, not just arithmetic
- Avoids treating a 60/40 as automatically “balanced” after a shock
- Documents why a trade is being made for the next review
When the rebalance will be implemented with ETFs rather than single names, ETF Research Analyst can compare structure, tracking, and true cost so the vehicle matches the allocation decision.
📱 Mobile risk review before an investment committee
Scenario: A PM is on the train, 40 minutes from a committee. Overnight futures imply a sharp open. They need to know whether the book is still inside limits and which three talking points to lead with.
Traditional Approach: Laptop VPN, a risk system login, and a scramble through last night’s batch report.
The same analyst on iOS or Android: Full feature parity with web. Paste overnight questions, pull the stored holdings, and get concentration flags, top exposures, and a short risk narrative suitable for the room.
- Works from the phone with the same holdings context as the desktop session
- Produces committee-ready language, not a raw dump of tickers
- Persistent memory keeps strategy, limits, and the last book without re-uploading
FAQ
Is Portfolio Management Strategist free?
Yes. Portfolio Management Strategist is available on a free tier with core analysis features and limited usage. Paid plans increase usage — Plus at $20/month, Premium at $50, Pro at $100, and higher tiers for heavier institutional workflows. No credit card is required to start. Usage resets monthly on the billing date, with the full limit available from day one rather than as a daily drip.
How is this different from portfolio tracking apps or terminal analytics?
Most tracking apps show balances and simple pie charts. Terminals and dedicated risk platforms remain the right tools for Monte Carlo, optimizer runs, VaR, and full Brinson attribution. This analyst sits in between: it ingests your holdings, applies strategy-aware concentration thresholds, explains drift in trades you can execute, and is honest when a request needs a quant engine. It does not replace a broker, a custodian, or a licensed advisor.
Can an AI portfolio strategist execute trades or connect to my broker?
No. It does not place orders, link brokerage accounts, or manage live positions. You receive allocation views, risk flags, and rebalancing lists; execution stays with you and your existing accounts. That boundary is deliberate — the product is portfolio intelligence, not a trading desk.
Does Portfolio Management Strategist work on mobile?
Yes. Web, iOS, and Android share feature parity, including speech-to-text and synced settings. Holdings context persists across devices, so a health check started on desktop can continue as a mobile review before a meeting.
How does AI portfolio analysis handle concentration risk?
It scores the book against explicit limits — single name, top five, sector, geography, asset class, and likely correlation clusters — then states which flags are breached and why. FINRA emphasizes that funds do not automatically protect you from stacking the same exposures; looking through to overlapping holdings is part of the same discipline. You can override defaults when the mandate (for example, a sector strategy) is supposed to be concentrated.
Can I upload a holdings CSV?
Yes. A standard file with ticker, asset class, quantity, current weight, and current value is enough for a first health check. Adding sector, currency, target weight, and cost basis enables drift-versus-policy, P&L, and tax-aware notes. Partial data is analyzed as far as it goes; missing fields are called out rather than invented.
Conclusion
Portfolios do not fail only because a call was wrong. They fail because weights drift, correlated names masquerade as diversification, and rebalancing waits for a calendar while risk accumulates in one sleeve. Morningstar’s 2025 evidence that a broader mix cushioned equity shocks is a reminder: allocation hygiene is a process, not a one-time pie chart.
Portfolio Management Strategist gives professional and serious individual investors a dedicated analyst for that process — allocation maps, concentration flags, drift trade lists, and regime-aware risk reads — without pretending to be a broker or a full quant stack. Try it on the book you actually hold. Explore more at Jenova.
For Developers: Portfolio Management Strategist is available programmatically via the Jenova API — integrate allocation analysis, drift detection, and concentration risk assessment into your application with a single API call. Full documentation →