AI Stock Analyst: Earnings, Valuation & SEC Filing Research
2026-08-28
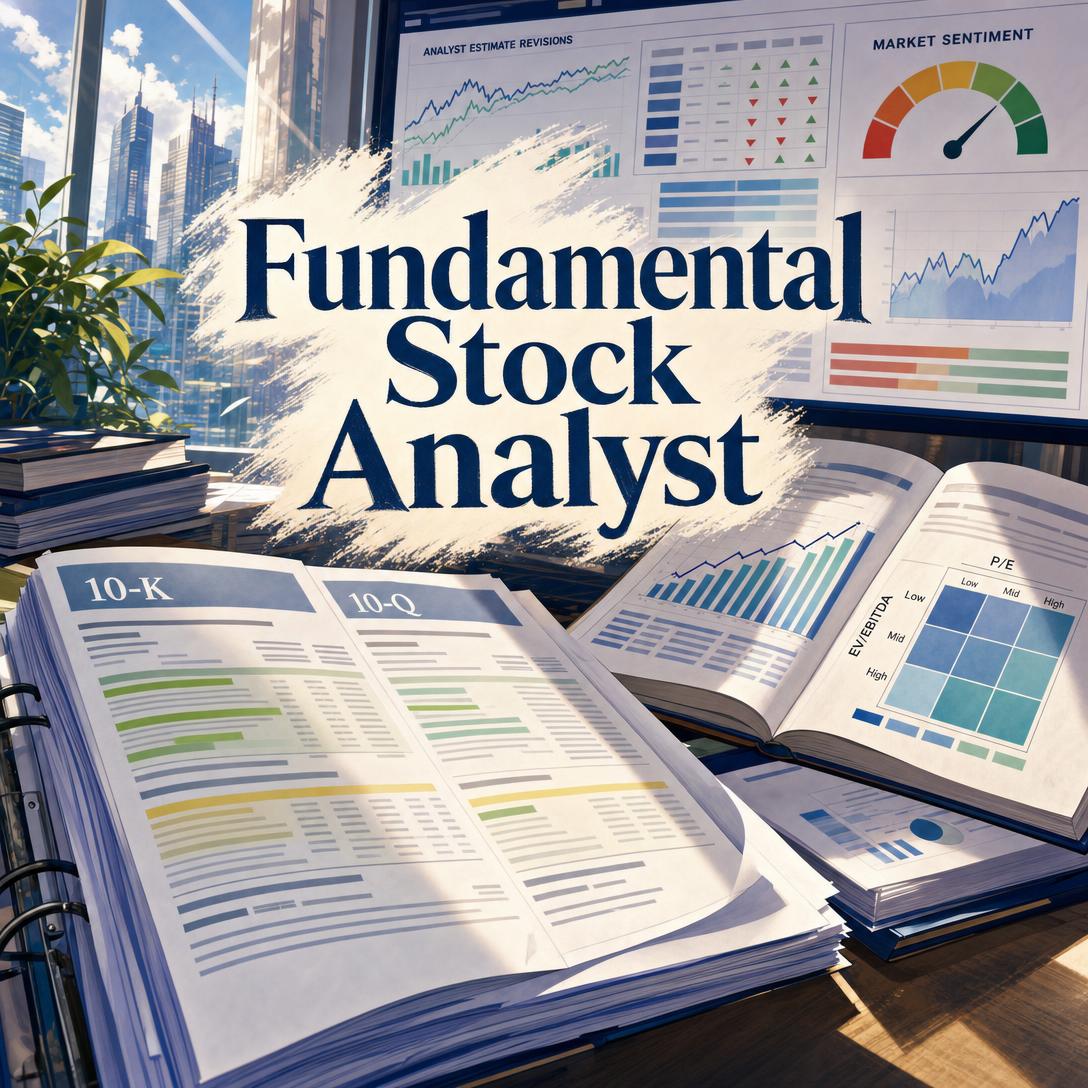
Fundamental Stock Analyst helps you analyze stocks the way a buy-side researcher would: business model first, then margins, cash generation, and relative valuation. While every 10-K, earnings release, and consensus estimate is public, turning that pile into a clear view of what's priced in is slow and easy to get wrong—especially when headline EPS crowds out the economics that actually drive value. This AI equity analyst leads with revenue and margin dynamics, compares companies on EV/EBITDA, and shows the work behind every premium or discount.
✅ Reads 10-Ks, 10-Qs, earnings, and Street estimates in context ✅ Relative valuation with peer comps, normalized inputs, and implied ranges ✅ Earnings analysis that compares actuals and guidance to consensus ✅ Educational, opinionated framing—market narrative vs. where it may be wrong
To understand why that structure matters, look at what investors are actually up against: dense filings, elevated multiples, and a market that still expects strong earnings. The data is available. The bottleneck is judgment, sequencing, and time.
Quick Answer: What Is Fundamental Stock Analyst?
Fundamental Stock Analyst is an AI equity researcher that turns SEC filings, earnings, and peer multiples into clear valuation context so you can see what's priced in. It is built for U.S. listed stocks, with the same frameworks applied carefully to other markets.
Key capabilities:
- Business-model, moat, and segment-driver analysis—not ticker trivia
- Earnings reviews that lead with revenue and margins, then beat/miss vs. estimates
- Relative valuation using EV/EBITDA as the default multiple, with peer rationale disclosed
- “What’s priced in” interpretation: the expectations embedded in today’s premium or discount
- Full equity-research memos on request, covering thesis, risks, and key debates
The Problem: Why Fundamental Research Breaks Down
Public-company data has never been more accessible. The SEC’s EDGAR system publishes 10-Ks, 10-Qs, and other filings for free, and the Commission even releases flattened financial-statement data sets so users can compare disclosure across registrants. The SEC’s own investor guide is blunt about the work that remains: no single statement tells the full story, footnotes carry the accounting choices that change the picture, and MD&A is where management explains what the numbers do not show.
That is the real workload. A serious fundamental process still means reading the income statement against the cash-flow statement, checking diluted share count, stripping one-time items, and deciding whether a peer set is honest. Most people do not fail because they cannot find a P/E. They fail because they start in the wrong place.
But doing this well, on a deadline, is frustratingly difficult:
- Filings are long; signal is buried. Annual reports mix audited financials with legal boilerplate. The 10-K is the comprehensive source, yet the useful bits—segment mix, margin trajectory, reinvestment needs—sit inside tables, footnotes, and MD&A.
- EPS is a noisy headline. Net income is polluted by accounting choices, tax timing, stock-based compensation, and one-time items. Leading with EPS is how investors miss a business whose gross margin is rolling over while “beats” keep printing.
- Multiples without context mislead. A cheap print can be a deteriorating franchise. A rich print can be justified by faster growth, expanding margins, or lower reinvestment. that a low price is not the same as a good value—and that overestimating future growth is a classic error.
- The market backdrop punishes sloppy comps. BlackRock’s fundamental-equities outlook flagged U.S. multiples around 22x earnings—the same area as the peak of the dot-com bubble—while still arguing that quality and expected growth change how that multiple should be read. Columbia Threadneedle similarly described valuations as elevated even as earnings growth was expected to broaden. In that tape, “is this cheap?” is a question about expectations, not a screenshot of one ratio.
22x earnings — U.S. equity multiples cited at the same level as the peak of the dot-com bubble
Mid-teens — Consensus-style earnings growth BlackRock described as an above-average setup for 2026
23 percent — Morgan Stanley’s U.S. equity strategist’s expected S&P 500 earnings growth in 2026
Those figures do not tell you whether your stock is attractive. They tell you why casual multiple-watching is a poor substitute for research. When the index is priced for continued earnings delivery, the edge is in reading a specific company’s revenue quality, margin path, and peer set—and in being honest about what the market already believes.
This is exactly what Fundamental Stock Analyst was built for.
Why Fundamental Stock Analyst
Fundamental Stock Analyst is a standalone equity-research product: an opinionated fundamental analyst that pulls live information, walks through the business, and puts valuation in peer context. It does not spit out a buy or sell rating. It shows implied prices from multiples, states assumptions, and frames the result as “what you need to believe,” not as a recommendation.
That distinction matters. Sell-side notes optimize for a target and a rating. Spreadsheet templates optimize for a single DCF that is only as good as five years of guessed cash flows. This analyst treats discounted cash flow as the conceptual gold standard—the only framework that explicitly models growth, margins, and reinvestment—while using relative valuation as the practical tool for screens, comps, and sanity checks. You get the intellectual honesty of DCF thinking without a fake-precise intrinsic-value print.
| Traditional Approach | Fundamental Stock Analyst |
|---|---|
| Start with EPS and a P/E screenshot | Lead with revenue, gross margin, and operating margin; treat EPS as consensus language, not business quality |
| Hours inside a 10-K with no estimate context | Filings plus Street estimates, guidance, and beat/miss in one pass |
| Peer set chosen to make the stock look cheap | Peer selection disclosed; sector median or a curated comps list, with why names were included or dropped |
| Terminal cost and fragmented tabs | Conversational research on web, iPhone, or Android with persistent memory of your watchlist and theses |
| Rating language (“Overweight”) that hides assumptions | Implied price ranges from peer EV/EBITDA, plus what the premium or discount is pricing in |
What you actually get
Business first, then the numbers. How does the company make money? What is the unit economics? Is the moat widening or narrowing? Growth from volume, price, mix, or a new product? Those questions come before any multiple, because a multiple is only a compressed story about the future.
High-signal fundamentals over low-signal earnings. Gross margin and its expected change speak to pricing power and input costs. Operating margin speaks to leverage and cost discipline. Segment mix shows where consolidated growth is real and where it is a mix shift. Those are the inputs that compound into future free cash flow. EPS is included when you need an estimate-comparison table—not as the narrative lead.
Relative valuation with the work shown. Default metric is EV/EBITDA: it strips capital-structure effects, reduces depreciation-policy noise, and sits closer to cash-generative capacity than net income. P/E appears when you ask for it or when EBITDA is the wrong lens (for example, banks). Inputs get normalized—non-recurring items, diluted shares, stock-based compensation treatment—so a “cheap” print is not an accounting artifact.
Earnings the way professionals read them. A 2% revenue beat means little if guidance disappointed. Forward commentary often moves the stock more than the quarter. Analysis compares actuals to consensus on revenue and operating income/EBITDA, then asks what actually changed in the business.
Variant perception, not a recap. Differentiated work is identifying where your view differs from consensus—and why you might be right. Bull case, bear case, two or three live debates, and the expectations gap: what is priced in versus what might happen.
Try a few starting prompts:
"Walk through Microsoft's latest quarter—revenue, gross and operating margin, segment mix, and how it compared to consensus. What actually mattered?"
"Is Salesforce cheap or expensive versus large-cap SaaS peers on EV/EBITDA? Disclose the peer set and what a premium would be pricing in."
"What's the market's narrative on NVIDIA right now, and where could consensus be wrong on datacenter growth and margins?"
If you already think in Graham-and-Buffett terms—moat durability, owner earnings, capital allocation—the Value Investing Advisor is a natural companion for quality-and-intrinsic-value work while this analyst stays on filings, estimates, and comps.
How It Works
You do not configure a model or upload a spreadsheet. You name a ticker (or a full question) and the AI stock analyst calibrates to you: precise CFA-style language gets a deep dive; a plain-English “is this expensive?” gets a clean multiple table and a short explanation of what it implies.
Step 1: State the stock and the decision you are actually making
A vague “tell me about Apple” gets a qualitative business briefing. “Is it cheap versus peers?” gets a quick EV/EBITDA and EV/Revenue read. “Full equity research report” gets a confirmation, then a long-form buy-side memo. Matching the question to the output keeps you from drowning in tables you did not ask for.
"I'm sizing a position in Costco. I need competitive position, margin durability, and how the current EV/EBITDA compares to big-box and membership peers."
Step 2: Lock the business model and the debates
Before valuation, you get how the company makes money, where the moat sits, what drives growth, and the two or three questions reasonable people disagree on. That is the filter. If you cannot explain the unit economics, a multiple will not save you.
"Explain Adobe's business mix, where growth is coming from, and the key bull/bear debate on generative AI and competitive threats."
Step 3: Read the financials the high-signal way
Revenue trend, margin trajectory, cash generation, balance-sheet flexibility, and reinvestment needs. For a print quarter, expect an estimate-comparison table (actual vs. consensus vs. beat/miss) and a plain-language take on guidance. The SEC reminds investors that cash flow is not the same as net income; this workflow treats that as a feature, not a footnote.
"Compare Home Depot's last four quarters on revenue growth, operating margin, and cash from operations. Flag anything that looks one-time."
Step 4: Run relative valuation with honest comps
You see reported vs. adjusted figures, a multi-metric table led by EV/EBITDA, a stated peer set, an implied range if the stock were priced at the peer median, and a sentence on what the current premium or discount requires you to believe. Peer choice is subjective and material—the analyst says so, and you can swap the set.
"Value Eli Lilly versus large-cap pharma on EV/EBITDA and EV/Revenue. Exclude companies with a totally different patent-expiry profile and tell me why."
Step 5: Leave with monitoring metrics, not a rating
The close is what to watch next: a margin line, a segment growth rate, a guidance bridge, an upcoming print. Frame is always implication of assumptions—“at peer median EV/EBITDA this implies about X per share”—never “buy it here.”
Try it free — no credit card required.
Results & Use Cases
📊 Earnings season, without the EPS theater
Scenario: It is 16 minutes after the print. The headline is a “beat,” the stock is down 7%, and you need to know whether guidance, mix, or margins are the real story before the call ends.
Traditional Approach: Flip between the press release, a consensus page, last quarter’s transcript, and a 10-Q—easy to miss that operating income missed while EPS beat on a lower tax rate.
Fundamental Stock Analyst: Actual vs. consensus on revenue and EBITDA/operating income, segment contribution, guidance vs. what the Street was embedding, and a short note on why the tape might be ignoring the headline.
- Estimate comparison is mandatory on earnings work, not optional color
- Narrative leads with revenue and margins; EPS stays in the table where it belongs
- Sources can be checked—filings, IR, and estimate pages—rather than treated as oracle output
💼 “Is it cheap?” with a peer set you can defend
Scenario: You are comparing two software names. One screens at 18x EV/EBITDA, the other at 28x. Your investment committee will ask why the cheap one is cheap.
Traditional Approach: A screen dump of P/Es, mixed fiscal year-ends, and a peer list that quietly includes a slower-growth, higher-leverage name to flatter the multiple.
This AI stock analyst: Same-basis EV/EBITDA, a disclosed comps list, normalized EBITDA (including how stock-based compensation is treated), and an explicit “premium justified by X / not justified unless Y.” That is the conversation you wanted, not a binary cheap/expensive stamp.
If you are still building the universe—quality compounders, net-nets, or a factor screen—the Stock Screener turns an investment philosophy into a data-backed list with red flags. Run the screen, then drop the shortlist here for filing-level work.
- Implied prices from peer medians, with assumptions visible
- Hybrid comps: sector median for speed, curated set for a deep dive
- Honest about limitations: a multiple is a snapshot, not a DCF
📱 Pre-market briefing on your phone
Scenario: You are on the train, markets open in 40 minutes, and two names you hold report before the bell. You need a briefing you can actually finish.
Traditional Approach: Desktop terminals and 80-page models do not travel. Phone browsers bury the margin bridge under ads and chart widgets.
Dedicated fundamental research on mobile: Full parity on iOS and Android. Ask for a 90-second setup: last-quarter miss/beat, consensus for tonight, the one debate that will move the stock, and the multiple vs. sector. Speech-to-text works if your hands are full.
"I hold CAT and DE. Before the open, give me the consensus setup, the margin debate, and how each screens versus industrial machinery peers on EV/EBITDA."
Once the fundamental thesis is clear and you care about when rather than whether, the Technical Stock Analyst can read price, volume, and market structure for defined-risk entries—without replacing the business work you just did.
FAQ
What is an AI stock analyst, and how is Fundamental Stock Analyst different?
An AI stock analyst is software that researches equities with live data instead of a static checklist. Fundamental Stock Analyst is specialized for fundamental work: SEC filings, earnings versus consensus, business-model quality, and relative valuation. It is not a charting app, not a news recap bot, and not a generic chatbot with a finance prompt. General models guess last quarter’s numbers. This one is instructed to search before citing prices, multiples, or estimates, and to show peer-selection rationale.
Is Fundamental Stock Analyst free? How much does it cost?
Yes. There is a Free plan at $0 with all core features and limited usage. Paid tiers start at Plus ($20/month, 30× usage) and scale through Premium, Pro, Max, Ultra, and Enterprise as you need more capacity, custom model selection, or support. Usage resets monthly on the billing date, with the full allowance available from day one—no daily drip caps. You can do real filing-and-comps work on Free; heavier report volume is what typically pushes a paid plan.
Can this AI stock analyst build a DCF or tell me to buy?
It will not produce a full discounted-cash-flow model, a three-statement forecast, or a buy/sell rating. Those are hard limits, not missing buttons. What you get instead is relative valuation with implied prices, DCF-informed discussion of growth/margins/reinvestment (what is priced in), and language like “at peer median EV/EBITDA this implies about X.” That is informational analysis, not licensed investment advice. For decisions, use a qualified financial professional—and, as the SEC notes, review the full Commission filings yourself.
How is this different from a Bloomberg terminal or ChatGPT?
A terminal is a data pipe: extraordinary if you already know which field, which adjustment, and which peer set. ChatGPT is a general reasoner that will happily invent a multiple if you let it. This product sits in between: conversational, opinionated on process (EV/EBITDA default, EPS last, disclose comps), and wired to search for current figures. It will not stream tick-by-tick prices or backtest 20 years of factors. It will walk a 10-Q, an estimate table, and a peer median in one sitting.
Does Fundamental Stock Analyst work on mobile, and can it remember my portfolio?
Yes. Web, iOS, and Android have the same capabilities, including speech-to-text. Chat history is unlimited, and memory persists across sessions—sophistication level, holdings you mention, tickers already analyzed, and open research threads. Mention that you own a name and think in GARP terms; later earnings questions get answered in that context. Settings sync across devices. Data is encrypted, not sold to advertisers, and not used to train public models.
How reliable is the valuation output?
Reliability is process, not prophecy. Strengths: forcing estimate comparisons on earnings, normalizing before multiplying, and refusing to treat a high multiple as automatically “wrong.” Weaknesses: relative valuation is a snapshot, peer choice moves the answer, and there is no live market-data feed—figures are the latest searchable prints with timestamps. Goldman Sachs Research and J.P. Morgan Global Research can disagree on growth even at the index level; a single-stock multiple inherits that uncertainty. Treat every range as “if these peers and these adjustments, then X,” and keep reading primary filings.
Conclusion
Fundamental analysis is not a vibe, and it is not a P/E on a screenshot. It is a structured attempt to understand a business, the cash it can generate, and the expectations already sitting in the price. Filings are free, index-level earnings have been forecast in the mid-teens to low-twenties, and multiples have been rich enough to punish anyone who skips peer context. The scarce resource is a repeatable way to go from 10-K to margin path to “what is priced in.”
Fundamental Stock Analyst is that workflow: an AI stock analyst for earnings quality, relative valuation, and SEC-based research, without pretend buy ratings. Try it on the name you are actually wrestling with—one earnings print, one comps table, one debate. Explore more at Jenova.
For Developers: Fundamental Stock Analyst is available programmatically via the Jenova API — integrate filing-aware earnings analysis and relative valuation into your application with a single API call. Full documentation →