AI ETF Analysis: How to Evaluate Holdings, Flows, and Overlap Risk
2026-08-19
The Portfolio Management Strategist helps you run institutional-grade AI ETF analysis by breaking down holdings concentration, sector overlap, and allocation drift across every thematic fund you hold. While the artificial intelligence ETF category has exploded into dozens of competing products with wildly different exposures, this AI analyst gives you the allocation clarity that a fund fact sheet never will.
✅ Detects hidden overlap between AI ETFs and your existing tech holdings ✅ Quantifies concentration risk across semiconductors, memory, and hyperscalers ✅ Runs scenario stress tests on thematic sleeves before you commit capital ✅ Delivers rebalancing recommendations grounded in your actual portfolio weights
To understand why this matters, consider what "AI exposure" actually means in practice. Two funds with nearly identical names can hold radically different companies, charge double the fees, and behave in opposite directions during a sector rotation. Getting AI ETF analysis right starts with knowing what you're actually buying.

Quick Answer: What Is AI ETF Analysis?
AI ETF analysis is the process of evaluating artificial intelligence exchange-traded funds by examining their underlying holdings, concentration levels, expense ratios, fund flows, and overlap with existing portfolio positions to determine genuine risk-adjusted exposure.
Key capabilities:
- Holdings decomposition — identifying what percentage of a fund sits in semiconductors versus software, infrastructure, or applications
- Overlap detection — measuring how much a new AI ETF duplicates positions you already own through broad index funds
- Cost analysis — comparing expense ratios against the category average and accounting for bid-ask spreads and premiums/discounts to NAV
- Flow interpretation — reading capital rotation between competing funds as a signal of institutional positioning
Each of these dimensions can be examined with the Portfolio Management Strategist rather than reconstructed manually from PDF fact sheets.
The Problem: Why AI ETF Analysis Is Harder Than It Looks
The artificial intelligence ETF category has scaled faster than most investors' ability to evaluate it. What began as a handful of thematic products is now a crowded field where naming conventions obscure meaningful differences in construction.
92 ETFs traded in U.S. markets with $50.80B in total assets under management and an average expense ratio of 0.74% — ETF.com Artificial Intelligence ETFs category data
That 0.74% average sits well above what passive broad-market products charge, and the SEC is explicit about why that gap matters:
"A fund with higher costs must perform better than a lower-cost fund to generate the same returns for you." — SEC Investor Bulletin on Mutual Fund and ETF Fees
But cost is only the entry point. Analyzing AI ETFs properly is frustratingly difficult:
- Label ambiguity — funds branded around "artificial intelligence" hold everything from chip fabricators to enterprise software to industrial robotics
- Concentration masquerading as diversification — a "diversified" thematic ETF may derive most of its return from five or six names
- Silent portfolio overlap — the AI ETF you just bought may be 60% redundant with the S&P 500 fund you already own
- Costs invisible in the fee table — brokerage commissions and NAV premiums/discounts never appear in the prospectus
- Flow data without interpretation — knowing money moved tells you nothing without understanding why
Concentration Risk Hides Behind the Word "Fund"
Investopedia notes that ETFs can offer limited diversification options in certain sectors, where investors may be restricted to large-cap names because the underlying index contains a narrow group of equities.
In AI thematics this problem is amplified. The investable universe of pure-play AI companies is small, so multiple competing funds end up owning substantially the same securities. Buying three AI ETFs frequently means buying one exposure three times, at three separate expense ratios.
Costs the Prospectus Doesn't Show You
The SEC's guidance is direct on this point. Beyond the expense ratio, ETF investors face brokerage commissions and pricing dislocations:
"An ETF's market price may reflect a premium or a discount to the ETF's underlying value or net asset value (NAV) per share." — SEC Investor Bulletin on Fund Fees and Expenses
For thinly traded thematic products, spreads widen and this dislocation grows. Investopedia observes that niche ETFs following low-volume indexes are more likely to carry wide bid/ask spreads — a cost that compounds every time you rebalance.
Intraday Pricing Invites Bad Behavior
Because ETFs trade continuously, thematic volatility becomes a behavioral trap. Investopedia warns that intraday price movements could induce longer-term investors to trade unnecessarily, turning a ten-year thesis into a series of emotional exits. justETF ranks "buying high, selling low" among the most common ETF investor mistakes — a failure mode that thematic funds, with their sharp drawdowns and violent rallies, make especially easy.
Flow Data Arrives Without Context
Capital rotation within the AI theme is constant, and the direction of that rotation carries information — if you can interpret it.
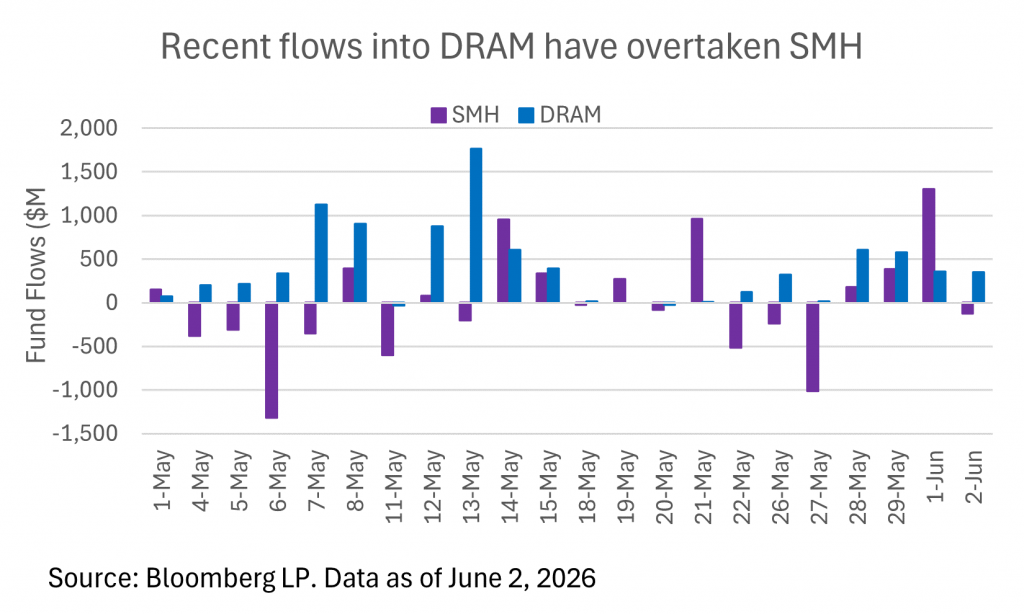
The chart above illustrates the analytical challenge precisely. Two semiconductor-adjacent products show sharply divergent flow patterns: one absorbing consistent inflows while the other swings between billion-dollar outflows and equivalent inflows. Raw flow data tells you capital is rotating. It doesn't tell you whether your portfolio is positioned on the right side of that rotation, or whether you already hold both exposures through a broader fund.
This is exactly what the Portfolio Management Strategist was built for.
Why the Portfolio Management Strategist for AI ETF Analysis
The Portfolio Management Strategist is an institutional portfolio analyst that evaluates AI ETFs the way an allocation committee would — starting from your actual holdings rather than from a fund marketing page. It performs allocation analysis, drift detection, risk assessment, scenario stress testing, and rebalancing recommendations in a single conversational workflow.
| Traditional Approach | Portfolio Management Strategist |
|---|---|
| Download PDF fact sheets from each issuer and compare manually | Upload or describe your holdings and get a consolidated exposure map |
| Guess at overlap between thematic and broad-market funds | Quantified overlap analysis across every position |
| React to headline flow data without portfolio context | Flow interpretation framed against your existing weights |
| Rebalance on gut feel or calendar dates | Drift detection with specific, sized rebalancing recommendations |
| Hire an advisor at institutional rates | On-demand allocation analysis, available continuously |
Allocation Analysis That Starts With Your Portfolio
Most AI ETF research is fund-centric — it evaluates the product in isolation. Allocation analysis inverts that. The question isn't "is this a good AI ETF?" but "what does this AI ETF add to what I already own?"
"I hold 40% VOO, 20% QQQ, and I'm considering adding a 10% position in an AI thematic ETF. Analyze the overlap and tell me what genuinely new exposure I'd be gaining."
Concentration and Drift Detection
Thematic sleeves drift faster than any other portfolio component. A 5% AI allocation that outperforms for two quarters can quietly become a 12% allocation — and a 12% allocation concentrated in six semiconductor names is a different risk profile entirely.
"My AI ETF sleeve has grown from 8% to 15% of my portfolio. Show me the concentration risk at the underlying holdings level and recommend a rebalancing plan."
Scenario Stress Testing
Understanding how a thematic sleeve behaves under stress matters more than understanding how it behaved in a rally.
"Stress test my portfolio for a 30% drawdown in semiconductor equities. How much of my total portfolio loss would come from AI-related exposure?"
The analyst translates each of these into concrete, position-level output — not generic commentary about diversification.
Related Agents You'll Also Find Useful
AI ETF analysis rarely stops at allocation. Three adjacent workflows come up constantly, and each has a dedicated agent.
Fundamental Stock Analyst — Because AI ETFs are concentrated, the fund's performance is largely the performance of its top holdings. Understanding those underlying businesses is inseparable from understanding the fund.
- Earnings analysis and relative valuation for individual ETF constituents
- Business model assessment across semiconductor, hyperscaler, and software names
- Real-time data across SEC filings, analyst estimates, and market sentiment
Technical Stock Analyst — If you're timing entries into a thematic sleeve or managing an existing position through volatility, price structure matters.
- Chart, volume, and momentum analysis on ETF tickers and their major holdings
- Market structure assessment for identifying high-probability setups with defined risk
- Objective framework for entry and exit levels rather than emotional intraday reactions
Macro Strategist — AI ETF flows respond to rate expectations, capex cycles, and policy shifts. Cross-asset context explains rotations that fund-level data cannot.
- Cross-asset synthesis connecting rates, credit, and equity thematics
- Policy analysis relevant to semiconductor trade restrictions and AI regulation
- Automated daily briefings for investors tracking a thematic position actively
Try the Portfolio Management Strategist free — no credit card required.
How AI ETF Analysis Works, Step by Step
Step 1: Define Your Current Exposure
Start by describing what you already own. Ticker-level detail with approximate weights is enough — the analyst reconstructs your effective exposure map from there.
"Here's my portfolio: 45% VTI, 15% QQQ, 10% individual tech names, 10% bonds, 20% cash. I want to add AI ETF exposure."
Step 2: Decompose the Candidate Funds
Ask for a holdings-level breakdown of the AI ETFs you're evaluating. The objective is understanding what slice of the AI value chain each fund actually represents — chips, memory, infrastructure, models, or applications.
"Break down the sector composition of the AI ETFs I'm considering. Which parts of the AI value chain does each one emphasize, and where do they overlap with each other?"
Step 3: Quantify Overlap and Redundancy
This is where most retail AI ETF analysis fails. Run the overlap check against your existing broad-market funds before you size the position.
"Calculate how much of this AI ETF's holdings I already own indirectly through my index funds. What's my true incremental exposure?"
Step 4: Size and Stress Test the Position
Determine an appropriate weight, then test it under adverse conditions before committing capital.
"Recommend a position size for this AI ETF given my risk tolerance, then stress test the portfolio under a sharp semiconductor correction."
Step 5: Set Drift Triggers and Rebalancing Rules
Thematic sleeves need rules, not intentions. Establish rebalancing bands upfront and revisit them on a defined cadence.
"Set rebalancing bands for my AI sleeve and tell me what portfolio drift level should trigger a trim."
Results & Use Cases
📊 Evaluating Competing AI ETFs Before a First Purchase
Scenario: An investor has narrowed the field to three AI-themed funds with similar names and materially different holdings.
Traditional Approach: Hours spent downloading fact sheets, manually cross-referencing top-10 holdings in a spreadsheet, and still missing overlap below the top-10 line.
Portfolio Management Strategist: A consolidated comparison showing sector composition, concentration levels, cost differences, and which fund adds genuinely new exposure relative to existing holdings.
- Identifies which fund is effectively a leveraged bet on existing positions
- Surfaces expense ratio differences against the 0.74% category average
- Recommends a single fund rather than a redundant basket
💼 Managing a Thematic Sleeve That Has Outgrown Its Target
Scenario: A 6% AI allocation has appreciated into a 14% position, and the investor is unsure whether to trim, hold, or let it run.
Traditional Approach: A calendar-based rebalance that ignores whether the concentration risk has actually changed at the holdings level.
Portfolio Management Strategist: Drift detection paired with underlying-holdings concentration analysis and a sized trim recommendation.
- Distinguishes between allocation drift and genuine risk-profile change
- Accounts for tax considerations in the trim sequencing
- Pairs with the Fundamental Stock Analyst for a valuation check on the top constituents driving the appreciation
📱 Interpreting Flow Rotation on Mobile Between Meetings
Scenario: Headlines report a sharp rotation out of one semiconductor ETF and into a memory-focused competitor. The investor holds the former and wants a read before market close.
Traditional Approach: Skim financial media, get conflicting narratives, make a decision without portfolio context.
Portfolio Management Strategist: Flow interpretation framed against actual holdings, accessible from a phone with full feature parity to desktop.
- Assesses whether the rotation is relevant to the specific positions held
- Flags whether the move represents a positioning shift or short-term noise
- Escalates to the Macro Strategist when the rotation is macro-driven rather than fund-specific
🎯 Building a Thematic Sleeve From Scratch
Scenario: A long-horizon investor wants deliberate AI exposure without concentrating the entire portfolio in one theme.
Traditional Approach: Buy the most-marketed AI ETF at whatever size feels comfortable, then discover the concentration problem during the first drawdown.
Portfolio Management Strategist: A constructed sleeve with defined weights, explicit rebalancing bands, and a documented rationale for each position.
- Prevents the common mistake of inadequate diversification that justETF identifies among ETF investors
- Establishes rules that survive volatility rather than dissolving under it
- Coordinates with the Technical Stock Analyst for entry timing across tranches
Frequently Asked Questions
What should I look for first in AI ETF analysis?
Start with holdings, not performance. Two AI ETFs with similar returns can hold entirely different companies across different segments of the AI value chain. Examine the top holdings, the concentration percentage in those names, and the sector split between semiconductors, infrastructure, and software. The Portfolio Management Strategist decomposes this automatically and frames it against what you already own.
Are AI ETFs more expensive than broad market funds?
Yes, meaningfully so. The artificial intelligence ETF category carries an average expense ratio of 0.74%, well above typical broad-index products. The SEC notes that higher-cost funds must outperform lower-cost funds simply to deliver equivalent returns — a hurdle worth quantifying before you commit.
How do I check if an AI ETF overlaps with funds I already own?
Compare the ETF's holdings against the constituents of your existing index funds, weighted by each fund's allocation. Large-cap AI names appear heavily in broad market indexes, so incremental exposure is often far smaller than the position size suggests. This overlap calculation is a core function of the Portfolio Management Strategist.
Is AI ETF analysis different from analyzing individual AI stocks?
They're complementary but distinct. ETF analysis focuses on construction, concentration, cost, and portfolio fit. Stock analysis focuses on business fundamentals and valuation. Because AI ETFs are concentrated, both matter — pair the Portfolio Management Strategist for allocation work with the Fundamental Stock Analyst for constituent-level research.
What do AI ETF fund flows actually tell me?
Flows reveal where capital is rotating within the theme — for example, from broad semiconductor exposure toward specific bottlenecks like memory. They signal institutional positioning but not necessarily future returns. Flow data becomes actionable only when interpreted against your own holdings and time horizon.
Can I do AI ETF analysis on mobile?
Yes. Jenova offers full feature parity across web, iOS, and Android, with settings synced across devices. You can run an overlap check or a drift analysis from a phone and pick up the same conversation on desktop later.
Conclusion
The AI ETF category has grown faster than the tools most investors use to evaluate it. Ninety-plus competing products, an above-average cost structure, heavy holdings overlap, and constant capital rotation make surface-level comparison genuinely unreliable. Choosing an AI ETF based on its name and its trailing return is how portfolios end up concentrated in six semiconductor stocks without anyone deciding to concentrate.
Rigorous AI ETF analysis fixes that. It starts with your existing exposure, decomposes each candidate fund to the holdings level, quantifies true incremental exposure, sizes the position deliberately, and sets rules that hold up through volatility. That's allocation work — and it's exactly what an institutional portfolio analyst does.
Try the Portfolio Management Strategist now to map your AI ETF exposure, detect overlap, and build a thematic sleeve with defined risk. Explore more expert analysts at Jenova.
For Developers: Portfolio Management Strategist is available programmatically via the Jenova API — integrate allocation analysis, overlap detection, and rebalancing logic into your fintech or wealth management application with a single API call. Full documentation →