AI Dividend Analysis: Screen Yields, Payout Safety & Income Growth
2026-08-19
AI dividend analysis helps you evaluate dividend safety, forecast income, and detect payout risk before a cut hits your portfolio. Instead of manually reconciling payout ratios, free cash flow coverage, and ex-dividend calendars across dozens of positions, the Fundamental Stock Analyst reads filings, pulls current estimates, and delivers a structured verdict on whether an income stream is durable — in minutes, not weekends.
✅ Payout ratio, free cash flow coverage, and balance sheet stress tested in a single pass ✅ Grounded in SEC filings, analyst estimates, and live market data ✅ Portfolio-level income forecasting, not just single-ticker screening ✅ Plain-language reasoning you can audit, not a black-box score
To understand why this matters, consider what income investors are actually up against. Dividend cuts rarely arrive without warning — the signals exist in the financials months in advance. The problem is that those signals live scattered across 10-Ks, cash flow statements, credit metrics, and sector context that few individual investors have the time or tooling to synthesize consistently.
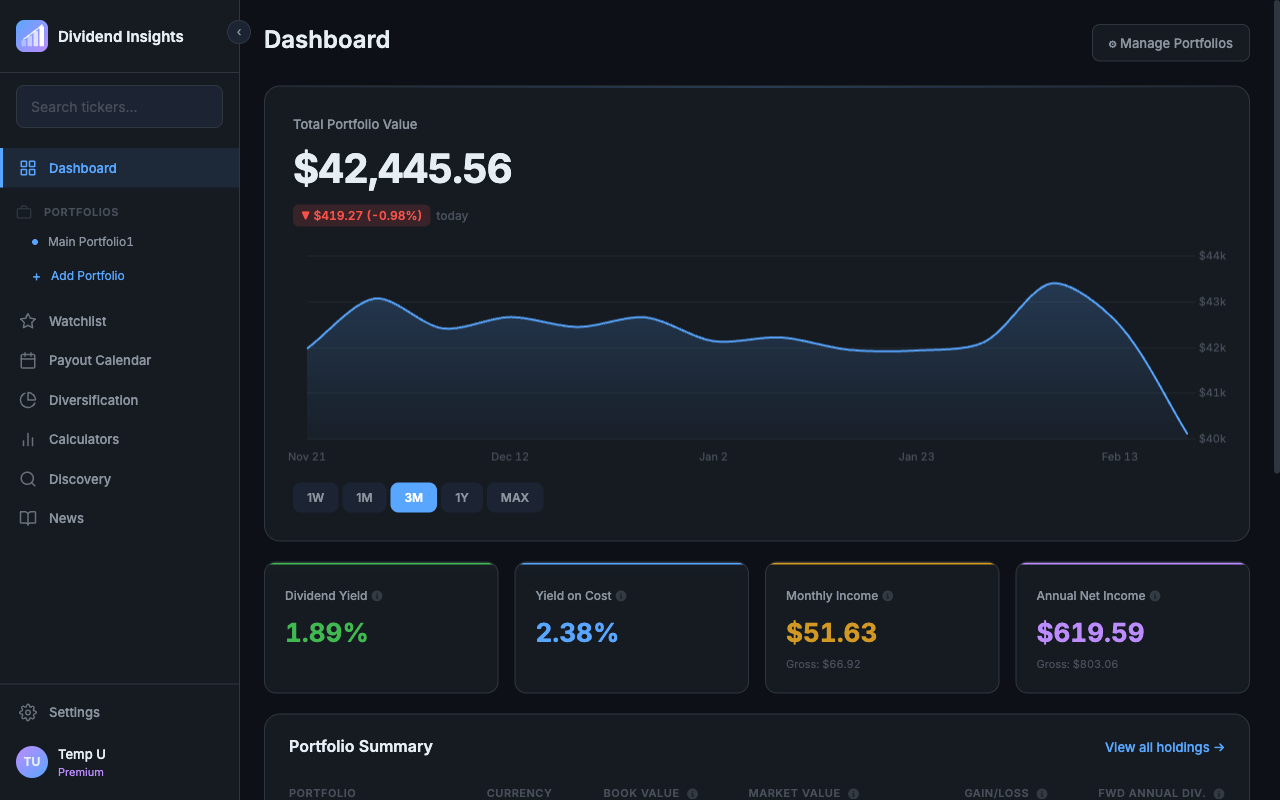
Quick Answer: What Is AI Dividend Analysis?
AI dividend analysis is the use of AI agents to evaluate dividend-paying stocks — assessing payout sustainability, yield quality, coverage ratios, and income growth potential by synthesizing filings, financial data, and market context automatically.
Key capabilities:
- Payout safety assessment — payout ratio, free cash flow coverage, and debt-service pressure evaluated together rather than in isolation
- Dividend trap detection — flagging high yields that reflect a collapsing share price rather than genuine income strength
- Income forecasting — projecting forward annual dividend income and yield on cost across a full portfolio
- Portfolio-level risk analysis — sector concentration and correlated cut risk surfaced via the Portfolio Management Strategist
The Problem: Why Dividend Research Breaks Down for Individual Investors
Dividend investing looks simple on the surface — buy quality companies, collect cash, reinvest. The execution is where it falls apart. A meaningful share of the market's long-run return has historically come from dividends, and institutional capital has recognized this: since 2008, institutional investors have poured more than $42 billion into equity-income funds while individual investors have withdrawn nearly $130 billion over the same period.
That gap is not an accident. Institutions have research teams. Individual investors have a brokerage screener and a spreadsheet.
32.28% — S&P 500 payout ratio as of the most recent year-end reading, indicating aggregate room for dividend growth — but aggregate figures conceal enormous dispersion at the individual company level.
But turning that structural opportunity into reliable income is genuinely difficult:
- Yield alone is a misleading signal — the highest yields often precede the deepest cuts
- Payout sustainability requires reading cash flow statements, not just earnings
- Dividend histories, ex-dates, and payment schedules live in fragmented sources
- Sector concentration creates correlated cut risk that single-stock analysis misses
- Tracking forward income across 20+ positions is a manual reconciliation nightmare
The Yield Trap Problem
A stock yielding 9% is either a mispriced opportunity or a company about to cut. Distinguishing between the two requires understanding why the yield is elevated. Usually it is because the price collapsed, not because management raised the payout.
The pattern is well documented in recent market history. Morningstar's analysis of dividend traps points to Dow as a case study: the stock fell nearly 37% in the year it cut its dividend by 50%. Investors screening on trailing yield were buying into deterioration, not value.
Payout Ratio Analysis Is Multi-Dimensional
The commonly cited rule of thumb is to look for payout ratios under 60% for stability and treat anything above 80% as a red flag. But a single threshold applied uniformly across sectors is analytically weak. REITs, utilities, and MLPs operate under entirely different payout norms than industrials or software.
Proper analysis requires evaluating the payout ratio against sector baselines, free cash flow rather than accounting earnings, and the company's debt maturity schedule. That is three separate research workflows per holding.
Analyst Coverage of Dividends Is Thin
Sell-side coverage concentrates on earnings, not distributions. Academic work examining the frequency and accuracy of analyst dividend forecasts across a large set of global firms has specifically studied how often analysts forecast dividends at all — and how useful those forecasts are to investors. For income-focused investors, the research gap is real.
The Time Cost Compounds
A thorough dividend safety review on a single holding — reading the latest filing, checking coverage trends, comparing sector peers, reviewing debt covenants — takes hours. Across a 25-position income portfolio reviewed quarterly, that is a part-time job.
This is exactly what AI dividend analysis was built for.
Why the Fundamental Stock Analyst Changes Dividend Research
The Fundamental Stock Analyst is an equity research agent built for exactly this kind of work: earnings analysis, relative valuation, business model assessment, and real-time data pulled from SEC filings, analyst estimates, and market sentiment. Applied to dividend investing, it collapses a multi-hour research process into a single conversation.
The value is not speed alone. It is consistency. Every holding gets the same analytical rigor, the same checklist, the same skepticism — which is precisely what manual research fails to deliver at scale.
| Traditional Approach | Fundamental Stock Analyst |
|---|---|
| Screen on trailing yield, hope for the best | Yield evaluated against coverage, cash flow, and price action |
| Read 10-K manually per holding | Filings parsed and synthesized on request |
| One payout ratio threshold for all sectors | Sector-adjusted payout benchmarks applied |
| Quarterly review takes a full weekend | Full portfolio pass in a single session |
| Analysis quality varies by attention span | Same analytical framework every time |
Payout Sustainability, Not Just Payout Ratio
Ask the agent to assess a dividend and you get the full picture: earnings payout ratio, free cash flow payout ratio, coverage trend over multiple years, debt-to-EBITDA context, and whether recent dividend growth was funded by operations or borrowing.
"Analyze the dividend safety of Verizon. Cover payout ratio on both earnings and free cash flow, coverage trend over five years, and whether the debt load threatens the distribution."
Dividend Trap Screening
Rather than treating high yield as attractive, the analysis inverts the question — why is this yield elevated, and what does the price action imply about the market's expectation?
"This stock yields 8.4%. Tell me whether the yield reflects genuine income strength or price deterioration, and identify any warning signs in the last two quarters of filings."
Comparative Income Analysis
Deciding between two income candidates requires normalizing across yield, growth rate, safety, and valuation simultaneously.
"Compare JPM, PG, and LOW as core dividend holdings. Rank them on payout safety, five-year dividend growth rate, and current valuation relative to their own history."
Real-Time Grounding
Because the agent pulls live data rather than relying on a static training snapshot, analysis reflects current filings and current prices. That matters enormously for dividend work, where a single quarter's cash flow deterioration can change the entire thesis.
The broader industry direction supports this approach. Amundi's research on AI in investment management notes that AI reduces data noise and enables analysis of unstructured sources that were previously inaccessible, while emphasizing that human oversight remains essential — AI informs the decision, it does not replace the decision-maker.
Related Agents You'll Also Find Useful
Dividend analysis rarely stays confined to single-stock research. These agents handle the adjacent work most income investors run into.
Portfolio Management Strategist
Once you have vetted individual dividends, the next question is portfolio construction. The Portfolio Management Strategist is an institutional portfolio analyst built for allocation analysis, drift detection, risk assessment, scenario stress tests, and rebalancing recommendations.
- Detect sector concentration that creates correlated dividend cut risk
- Stress test portfolio income under recession or rate-shock scenarios
- Generate rebalancing recommendations that preserve income while reducing risk
Macro Strategist
Dividend performance is heavily regime-dependent. Rate policy, inflation, and sector rotation all move income equities. The Macro Strategist delivers cross-asset synthesis, policy analysis, and automated daily briefings.
- Understand how rate expectations affect utilities, REITs, and financials differently
- Track policy shifts that change the relative attractiveness of dividend equities versus bonds
- Receive recurring briefings on the macro backdrop for income investing
Technical Stock Analyst
Entry timing affects yield on cost materially. The Technical Stock Analyst reads price action, volume, and market structure to identify setups with defined risk.
- Identify support levels for accumulating income positions
- Distinguish healthy consolidation from structural breakdown in a dividend payer
- Set risk-defined entries rather than averaging into deterioration
Economics Analyst
For investors who want to understand the mechanism rather than the headline, the Economics Analyst provides institutional-grade coverage of macro, policy, and sector dynamics with mechanism tracing and scenario analysis.
Try Jenova free — no credit card required.
How AI Dividend Analysis Works
Step 1: Bring Your Holdings to the Analyst
Start with a ticker, a list, or a full portfolio export. Describe what you hold and what you are trying to evaluate — safety, growth, or a buy/sell decision.
"Here are my 12 dividend holdings with cost basis and share counts. Assess overall income durability and flag the three highest-risk positions."
Step 2: Request Structured Safety Analysis
Specify the dimensions that matter to you. The more precise the request, the more useful the output. Ask for coverage ratios, trend data, and sector-adjusted context explicitly.
"For each holding, give me payout ratio on free cash flow, five-year dividend growth CAGR, and a safety rating with reasoning. Flag anything where coverage has deteriorated for two consecutive years."
Step 3: Project Forward Income
Move from safety to forecasting. Ask the agent to model forward annual income under different assumptions — no dividend growth, historical growth rate, or a stress scenario with one or two cuts.
"Project my forward 12-month dividend income under three scenarios: zero growth, historical average growth, and a scenario where my two weakest holdings cut by 50%."
Step 4: Escalate to Portfolio-Level Review
Hand the findings to the Portfolio Management Strategist for allocation analysis. Concentration risk in income portfolios is common and rarely visible from single-stock review.
"Given these holdings, analyze sector concentration and tell me where a single macro shock could hit multiple dividends simultaneously."
Step 5: Track and Revisit
Because sessions retain full history, your dividend thesis persists. Return next quarter and ask what changed rather than rebuilding the analysis from scratch.
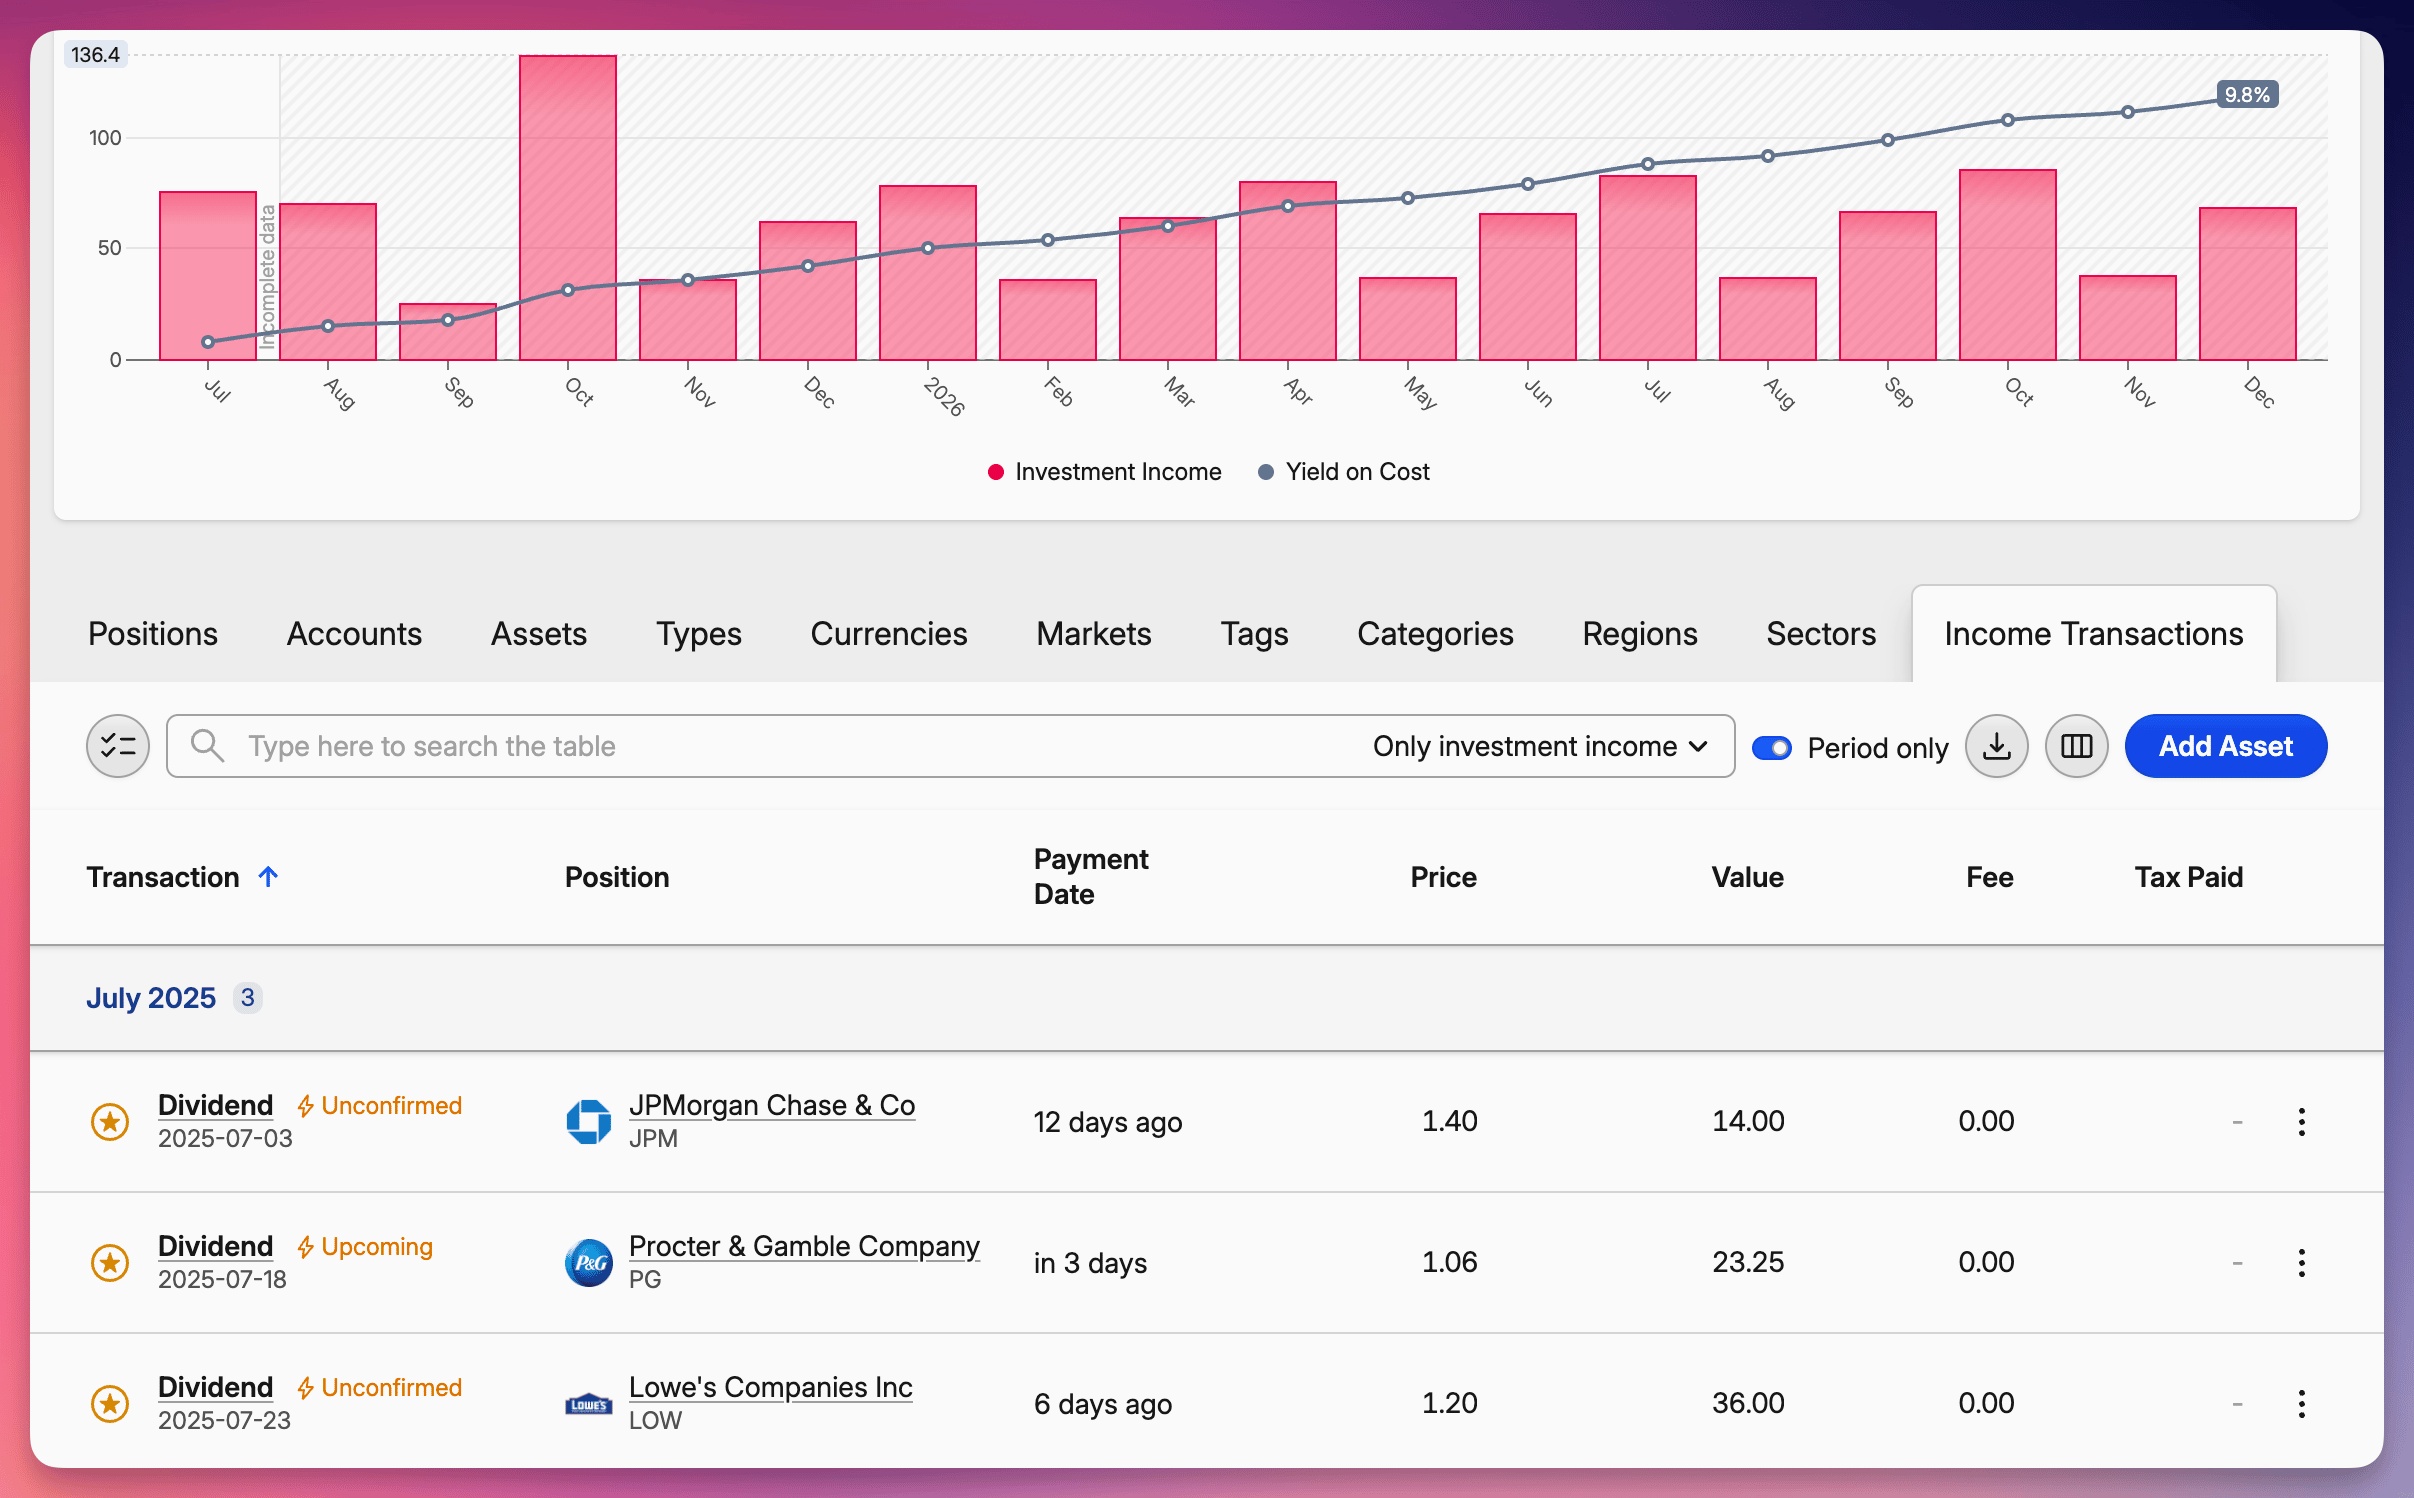
Results & Use Cases
📊 Quarterly Dividend Safety Review
Scenario: A retiree holds 22 dividend stocks and needs to confirm income durability before the next distribution cycle.
Traditional Approach: Six to eight hours pulling filings, building a spreadsheet, and cross-referencing payout ratios against sector norms — typically done once a year because the effort is prohibitive.
Fundamental Stock Analyst: A structured safety pass across all 22 positions in one session, with the weakest three flagged and reasoning attached.
- Every holding reviewed with identical rigor
- Coverage trends surfaced, not just current-quarter snapshots
- Review frequency shifts from annual to quarterly because the cost dropped
💼 Pre-Purchase Dividend Due Diligence
Scenario: An investor is considering a 7.2% yielder in the energy sector and wants to know whether the distribution is defensible.
Traditional Approach: Read the latest 10-Q, check the dividend history, search for analyst commentary, and hope nothing was missed in the footnotes.
Fundamental Stock Analyst: Direct assessment of coverage, debt maturity pressure, commodity sensitivity, and management's stated payout policy — with an explicit trap-risk verdict.
- High yield interrogated rather than assumed attractive
- Sector-specific payout norms applied
- Balance sheet stress evaluated alongside the income statement
🎯 Building a Diversified Income Portfolio From Scratch
Scenario: An investor with $80,000 wants to construct an income portfolio targeting durable yield without sector concentration.
Traditional Approach: Screen for yield, pick recognizable names, and discover months later that 60% of the income comes from three correlated sectors.
Jenova: The Fundamental Stock Analyst vets candidates for safety while the Portfolio Management Strategist enforces allocation discipline.
- Candidate screening and construction handled as one connected workflow
- Correlated cut risk identified before capital is committed
- Stress-tested against rate and recession scenarios
📱 On-the-Go Dividend Decisions
Scenario: A dividend announcement drops mid-day and an investor needs a fast read on whether it changes the thesis.
Traditional Approach: Wait until evening, open a laptop, and reconstruct context that has already gone stale.
Jenova on mobile: Full feature parity across iOS and Android — ask the analyst directly from the phone, with the prior session's context intact.
- Same analytical depth on mobile as on desktop
- Session history means no re-explaining your holdings
- Voice input for hands-free queries
Frequently Asked Questions
Can AI accurately predict dividend cuts?
No tool predicts cuts with certainty, and any that claims to should be treated skeptically. What AI dividend analysis does well is surface the financial deterioration that typically precedes a cut — declining free cash flow coverage, rising payout ratios, and mounting debt pressure. The Fundamental Stock Analyst makes these signals visible and explains the reasoning, so you evaluate the evidence rather than trusting a score.
Is AI dividend analysis free to use?
Jenova offers a free tier with access to all core features, including the Fundamental Stock Analyst, at limited usage. Paid tiers start at $20/month and scale usage substantially while adding custom model selection. Most investors can complete a full portfolio dividend review on the free tier before deciding whether higher usage limits are worth it.
How is this different from a standard dividend screener?
Screeners filter on numbers. They will show you every stock yielding above 5% with a payout ratio under 70% — but they cannot tell you why a yield is elevated or whether coverage is deteriorating. AI dividend analysis reads the underlying filings, evaluates context, and delivers reasoning you can interrogate and push back on.
Does it use current data or a training snapshot?
The Fundamental Stock Analyst pulls real-time data from SEC filings, analyst estimates, and market sources rather than relying solely on training data. This matters for dividend work, where a single quarter's cash flow change can invalidate a thesis.
Should AI replace my own judgment on dividend investing?
It should not, and the professional research consensus agrees. Amundi's work on AI in investment management explicitly concludes that it is both unlikely and undesirable for AI to replace human-led final investment decisions — human oversight remains essential for managing model bias and catching what the data misses. Treat the analysis as a rigorous, tireless research associate: it does the synthesis, you make the call.
Can it analyze REITs, MLPs, and closed-end funds?
Yes, though these structures require different analytical frameworks — REITs are evaluated on FFO and AFFO rather than EPS, and MLPs on distributable cash flow. State the security type in your request so the appropriate payout metrics are applied.
Conclusion
Dividend investing rewards discipline, and discipline is exactly what manual research fails to sustain. The signals that precede a dividend cut — thinning free cash flow coverage, payout ratios drifting past sector norms, debt maturities crowding out distributions — are visible in the filings well before the announcement. The barrier has never been availability. It has been the hours required to look, consistently, across every holding, every quarter.
AI dividend analysis removes that barrier. The Fundamental Stock Analyst applies the same analytical rigor to your twenty-second holding as your first, grounds every assessment in current filings and market data, and shows its reasoning so you can challenge it. Pair it with the Portfolio Management Strategist for allocation discipline and the Macro Strategist for regime context, and you have an income research process that holds up under scrutiny.
Stop screening on yield alone. Start analyzing payout durability.
Try the Fundamental Stock Analyst now — explore the full agent library at Jenova.
For Developers: Fundamental Stock Analyst is available programmatically via the Jenova API — integrate equity and dividend research into your fintech application with a single API call. Full documentation →